Ethereum (ETH/USD) Market Hovers at $4,000
Estimated Reading Time: 3 minutes
Don’t invest unless you’re prepared to lose all the money you invest. This is a high-risk investment and you are unlikely to be protected if something goes wrong. Take 2 minutes to learn more
Ethereum Price Prediction – December 27
There has been a long-holding of the ETH/USD trade operations around a specific higher trading line as the crypto market hovers at $4,000.The crypto’s price has earlier witnessed a low of about $4,005 and a high of about $4,154 today. But, as of writing, the crypto trades around $4,095 at a smaller percentage rate of about 0.75 positives.
ETH/USD Market
Key Levels:
Resistance levels: $4,250, $4,500, $4,750
Support levels: $3,750, $3,500, $3,250
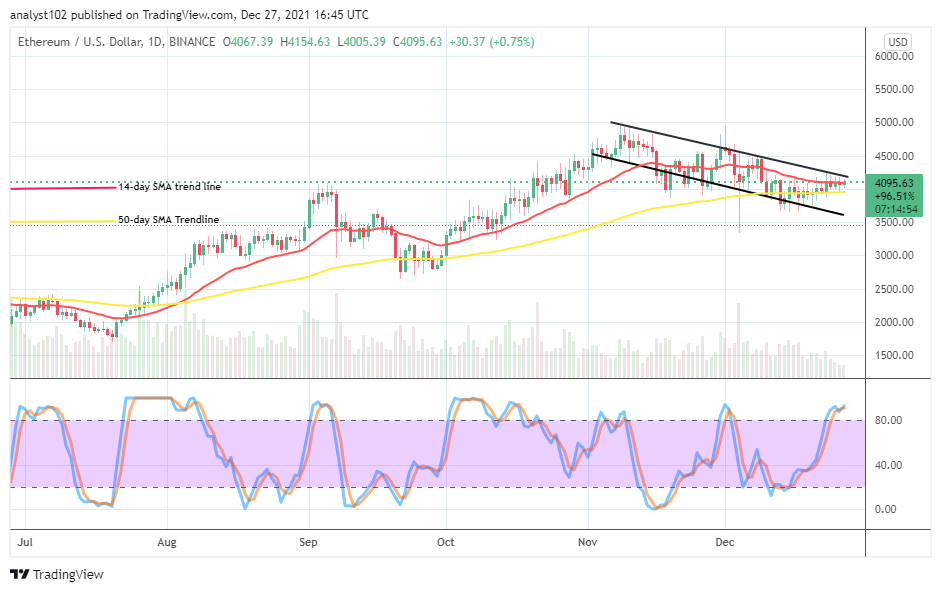
ETH/USD – Daily Chart
The ETH/USD daily chart showcases that the crypto-economic market hovers at $4,000. The 14-day SMA trend line is above the 50-day SMA trend line within the space of the bearish correction channel trend lines drawn. The Stochastic Oscillators are in the overbought region. And they have conjoined the lines within it. An indication suggests the crypto market will soon experience a pit stop around a higher trading spot.
Can the ETH/USD trade operations witness more ups as the crypto market hovers at $4,000?
There have been several re-surfacing of the ETH/USD trade valuation around a specific higher trading spot as the crypto market hovers at $4,000. It t is, yet, expected not to push higher above that value-line for significant profits afterward. Currently, there is no reliable signal to portend getting more ups. Therefore, buyers should be cautious of sudden less-active upsurges around the 14-day SMA.
On the downside of the technical analysis, the ETH/USD market sellers may have to be alert as to when there will be a reversal motion while price hits resistance around the trend line of the bearish channel drew before considering a sell order. The present indication suggests an overbought trading condition for the crypto economy. A sell-off moment may soon dominate the trading operations for a while.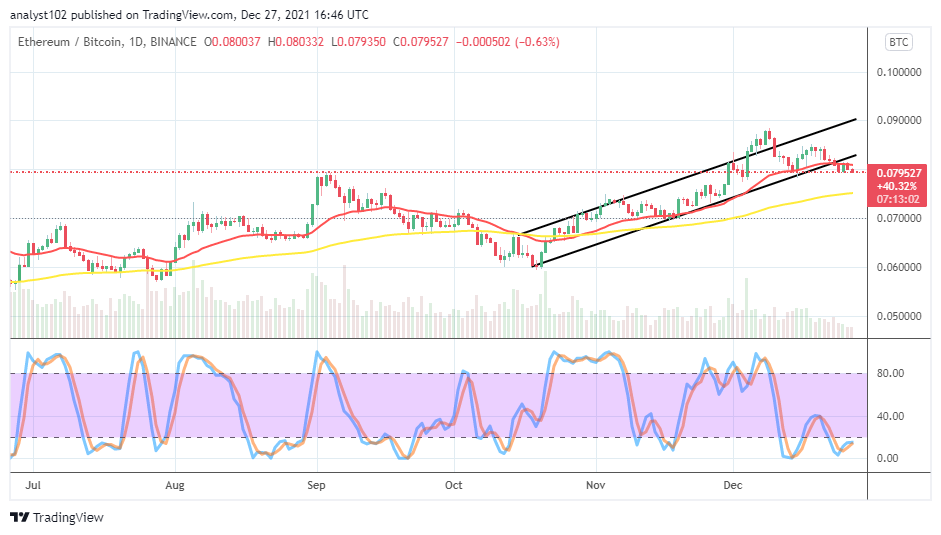
ETH/BTC Price Analysis
In comparison, Ethereum’s pushing ability seems gradually diminishing paired with Bitcoin around a higher trading spot on the price analysis chart. The cryptocurrency pair market hovers around the trend line of the smaller SMA. The 50-day SMA indicator is above the 14-day SMA indicator. The stochastic Oscillators are in the oversold region, trying to cross the lines somewhat southbound closely underneath the range of 20. That signifies that the base crypto tends to lose some of its stances to the flagship counter crypto for some time.
Note: Cryptosignals.org is not a financial advisor. Do your research before investing your funds in any financial asset or presented product or event. We are not responsible for your investing results.
You can purchase crypto coins here. Buy Tokens