Ethereum (ETH/USD) Establishes New Support Base at $2,400
Estimated Reading Time: 3 minutes
Don’t invest unless you’re prepared to lose all the money you invest. This is a high-risk investment and you are unlikely to be protected if something goes wrong. Take 2 minutes to learn more

The Ethereum (ETH/USD) market has recently exhibited upward volatility, driving the price to a high near the $2,700 level. However, as the rally matured, profit-taking activities emerged, prompting a downward correction.
Following the retracement, Ethereum appears to have found a new support base around the $2,400 level. Notably, there are early signs of renewed bullish interest at this zone. This is evidenced by the presence of a long lower shadow beneath a recent bearish candlestick, suggesting buyers are beginning to step in and defend this level.
If bullish momentum continues to build from this point, ETH could be positioning for another leg to the upside.
Ethereum Market Data
- ETH/USD Price Now: $2,407
- ETH/USD Market Cap: $289 billion
- ETH/USD Circulating Supply: 120.7 million ETH
- ETH/USD Total Supply: 120.7 million ETH
- ETH/USD CoinMarketCap Ranking: #2
Key Levels
- Resistance: $2700, $3000 and $3500
- Support: $2500, $2200, and $2000
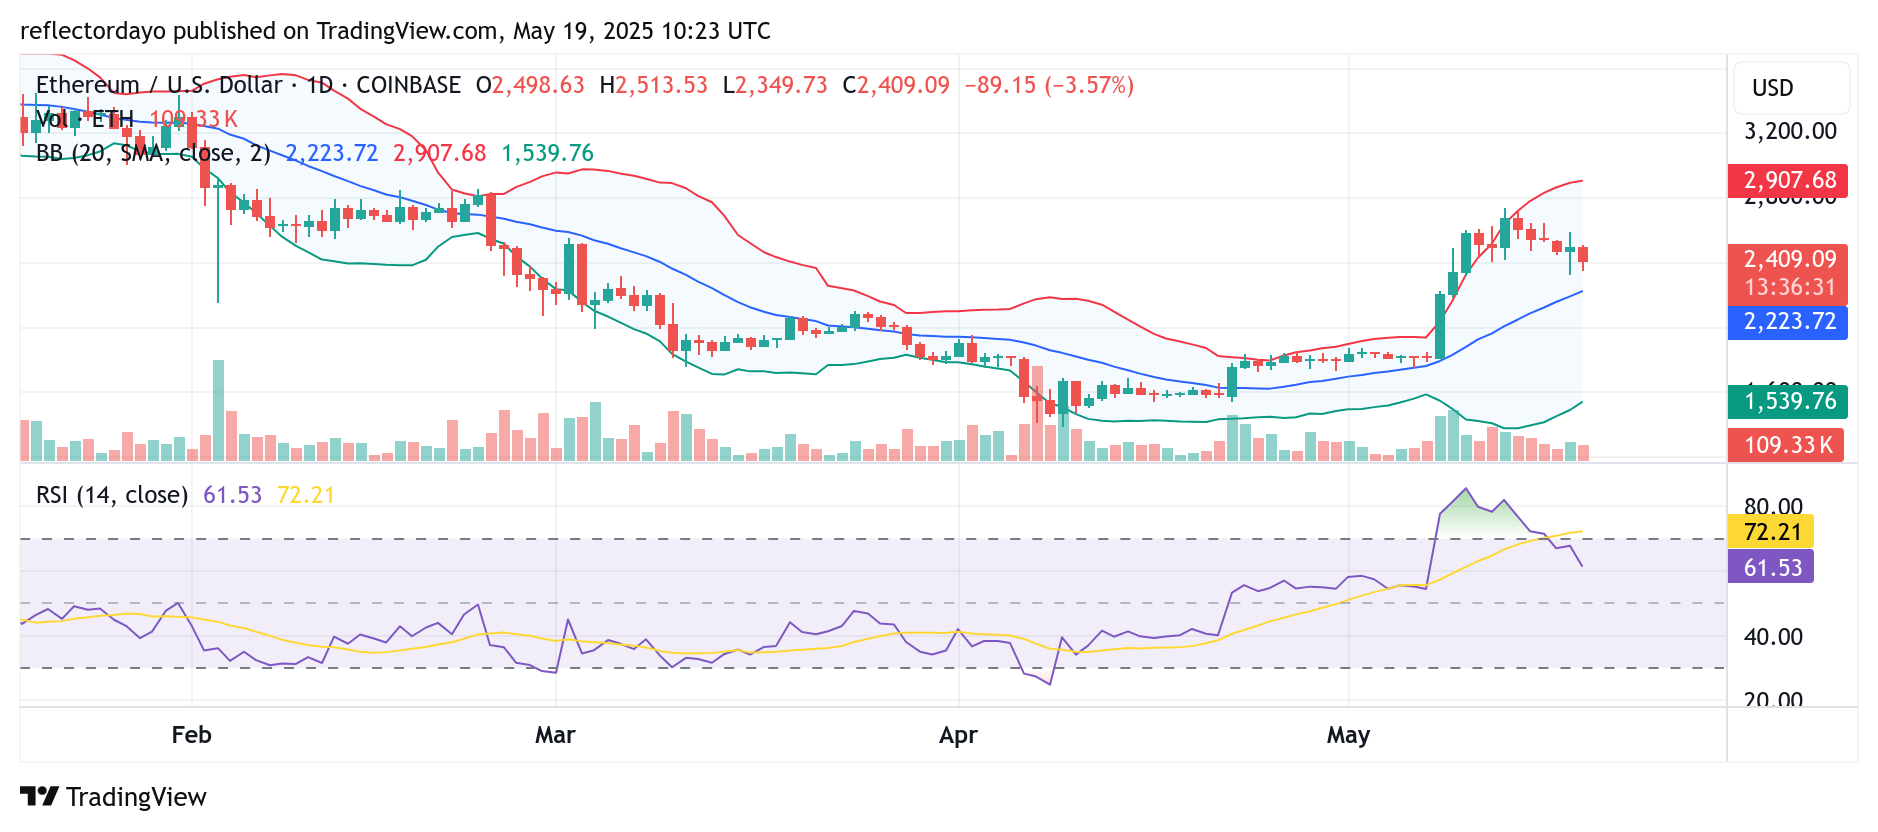
Technical Outlook: Ethereum Retreats After Overbought Conditions, Shows Signs of Stabilization at $2,400
Following a recent surge driven by heightened bullish sentiment, the Ethereum (ETH/USD) market entered overbought territory, as indicated by key technical indicators. During this upward move, traders aggressively accumulated positions, pushing the price toward the $2,700 resistance level. However, caution set in near this threshold, prompting profit-taking—a common market reaction when prices reach overextended zones.
This correction phase has been marked by increasing bearish momentum, which has dominated most of today’s trading session. The downward movement continued until ETH approached the $2,400 support level. At this point, early signs of renewed bullish interest have begun to emerge.
The appearance of modest buying activity at this support zone suggests that bullish sentiment may not be entirely exhausted, potentially setting the stage for a market stabilization or even a rebound in the short term.

4-Hour Chart Analysis: $2,400 Emerges as Key Support Zone Following Previous Resistance Role
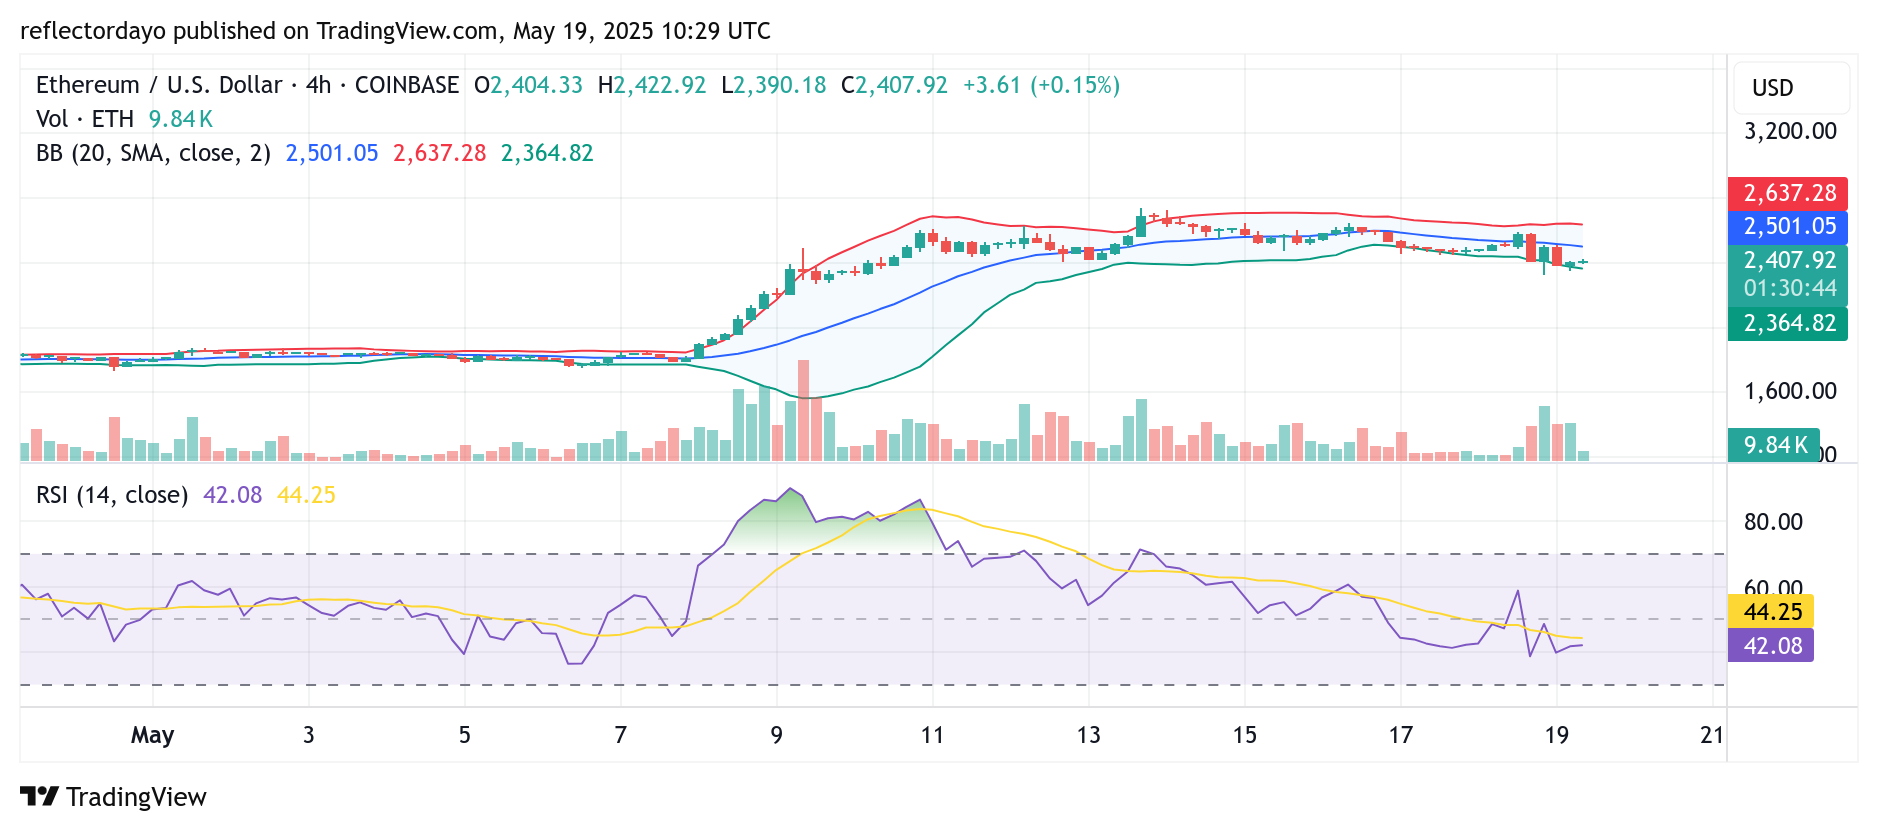
On the ETH/USD 4-hour chart, the $2,400 price level has established itself as a critical support zone. One of the key reasons for this is its previous role as a brief resistance during the recent bullish rally. This historical interaction lends added technical significance to the level, making it a logical area for buyers to re-enter the market.
Positioned just below the $2,700 resistance zone, $2,400 now functions as a natural support. Current price action reflects a state of indecision, as buyers and sellers engage in a tug-of-war at this level. This is evident from the consolidation pattern forming on the chart, suggesting a temporary equilibrium between supply and demand.
If this balance continues, we may see a sharp decline in both trading volume and volatility—often a precursor to a significant breakout. Traders should watch closely, as this compression phase could signal an impending directional move in the market.