The Aave Market (AAVE/USD) Eyes $250 as Bullish Momentum Builds
Estimated Reading Time: 3 minutes
Don’t invest unless you’re prepared to lose all the money you invest. This is a high-risk investment and you are unlikely to be protected if something goes wrong. Take 2 minutes to learn more
The Aave market is showing renewed strength as bullish momentum pushes prices higher. After a brief consolidation around the $223 level—where buyers and sellers were locked in a standoff—the bulls have taken control. With a decisive breakout from this range, AAVE is now stretching toward the critical $250 resistance level. So far, today’s trading session reflects sustained bullish pressure, reinforcing the likelihood of further upward movement.
Aave Market Data
- AAVE/USD Price Now: $244
- AAVE/USD Market Cap: $3.7 billion
- AAVE/USD Circulating Supply: 15 million AAVE
- AAVE/USD Total Supply: 16 million AAVE
- AAVE/USD CoinMarketCap Ranking: #31
Key Levels
- Resistance: $250, $300 and $350
- Support: $200, $150, and $100
Technical Outlook on the Aave Market: Bulls Face Key Test Near $250 Resistance
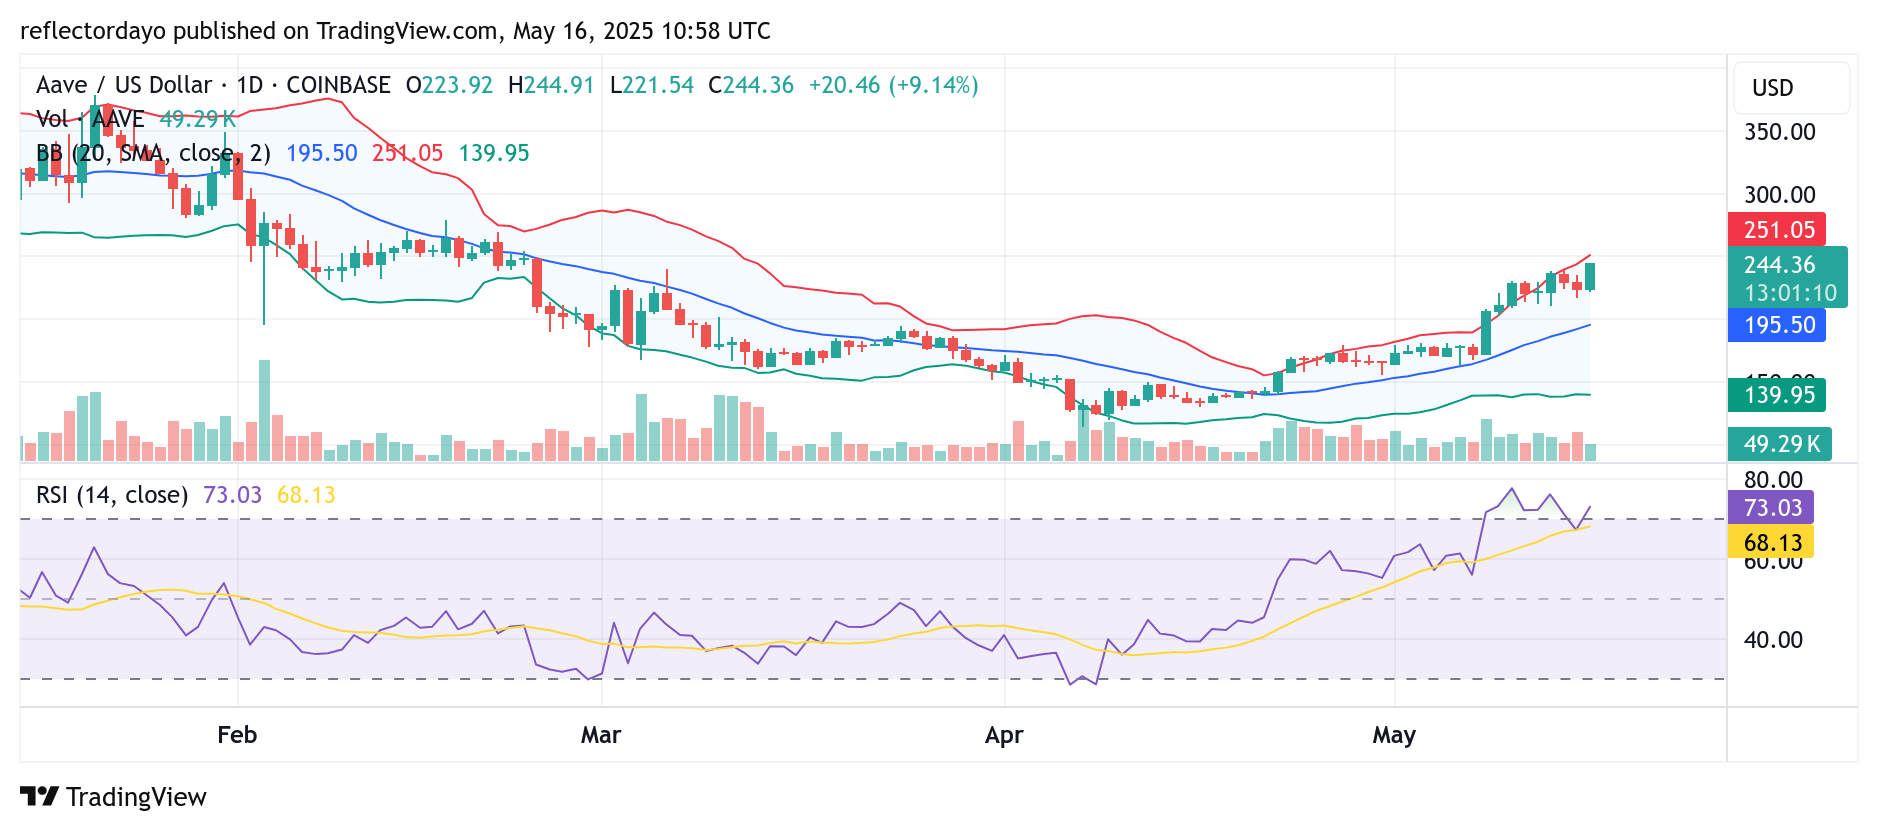
The Aave market‘s technical indicators suggest that bullish momentum may be gaining ground, as evidenced by the appearance of a small Marubozu candlestick and a relatively strong volume of trade histograms. These signals point to a potential shift in market sentiment in favor of the bulls.
However, caution is warranted. The widening Bollinger Bands indicate increasing market volatility, which could invite bearish pressure around the critical $250 resistance level. This heightened volatility presents an opportunity for bears to counter the upward move, potentially eroding recent gains and pushing the price back toward the previous consolidation zone at $223.
Adding to the uncertainty, the Relative Strength Index (RSI) is currently in overbought territory. This crypto signal suggests that the current rally may be overextended, and a pullback or consolidation could be imminent.
Nevertheless, if bullish sentiment remains intact, the market may enter a consolidation phase near the current level before attempting a breakout above the $250 mark.

AAVE/USD 4-Hour Chart: Bullish Momentum Approaches Key Resistance
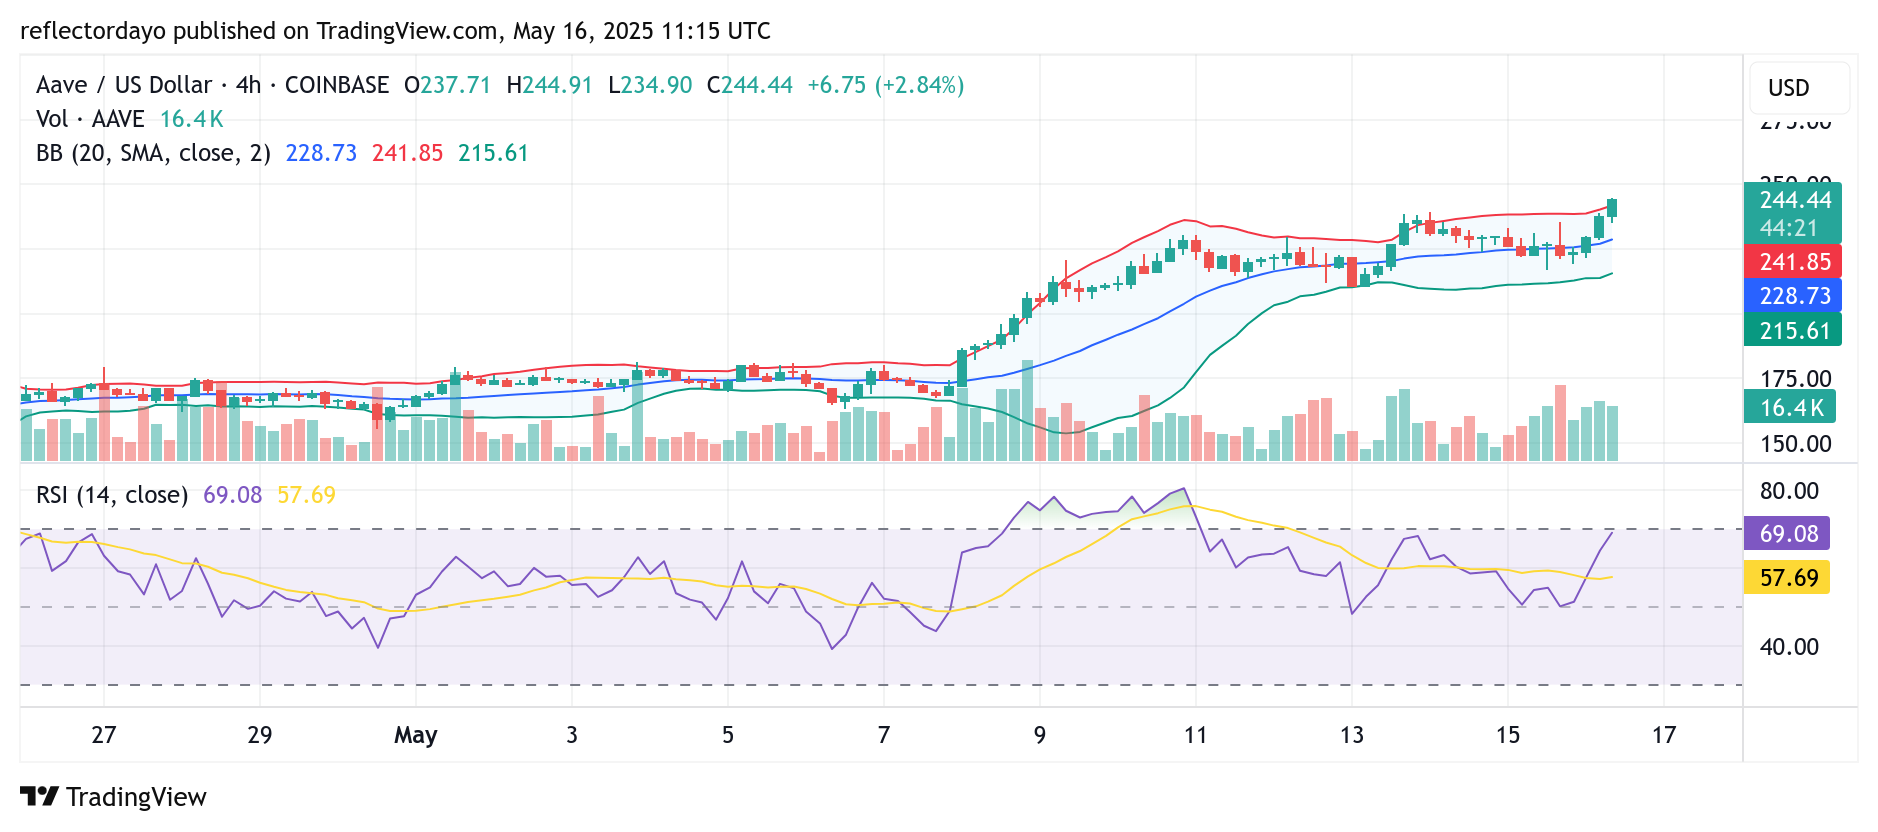
The 4-hour chart of AAVE/USD reveals a clear picture of the ongoing bullish progression. The market has steadily gained momentum, climbing from the consolidation zone around the $223 level toward the critical $250 resistance. This upward movement is supported by healthy trading volumes, as reflected by the substantial histogram bars, suggesting strong market participation and sentiment backing the trend.
However, as the price approaches the $250 mark, caution may begin to set in among traders. This level is being closely watched, as it could determine whether the bullish run continues or faces a potential pullback. For now, all eyes remain on this key resistance to gauge the next direction for AAVE.