$SPONGE (SPONGE/USD) Holds Steady at $0.000038 Amid Market Uncertainty
Estimated Reading Time: 3 minutes
Don’t invest unless you’re prepared to lose all the money you invest. This is a high-risk investment and you are unlikely to be protected if something goes wrong. Take 2 minutes to learn more

The SPONGE/USD market has been consolidating around the $0.000039 price level for some time, as bearish sentiment continues to dominate near the $0.00004 resistance level. Analyzing the 4-hour chart, we observe that bearish pressure recently tested the $0.0000006 support level, a key price point in this market. However, following this test, the market quickly rebounded as traders capitalized on the dip, driving prices higher. Despite this bullish reaction, selling pressure remains strong at $0.00004, limiting further upward movement.
Key Price Levels:
- Resistance: $0.000040, $0.000045, $0.000050
- Support: $0.000019, $0.000018, $0.000017
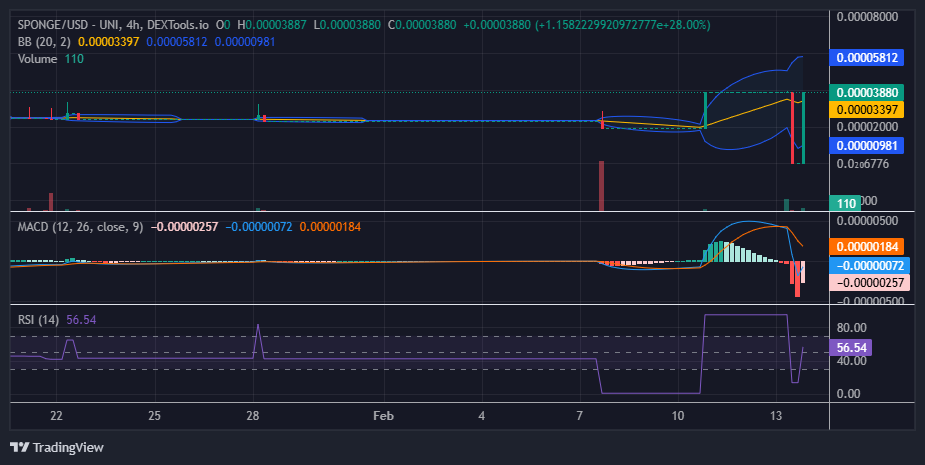
$SPONGE Technical Analysis
The $0.000039 price level faced a sharp rejection, which was clearly reflected in the Moving Average Convergence and Divergence (MACD) indicator. The negative histograms expanded significantly, while the faster MACD line moved swiftly toward the zero level, signaling strong bearish momentum. However, this downward move was short-lived as traders quickly bought the dip, taking advantage of the market’s volatility. The subsequent bullish recovery was just as rapid, pushing the price back up. Given this swift rebound, the market stands a strong chance of breaking above the $0.00004 resistance level and sustaining an upward continuation, as the SPONGE/USD bulls have demonstrated resilience in reclaiming lost ground.
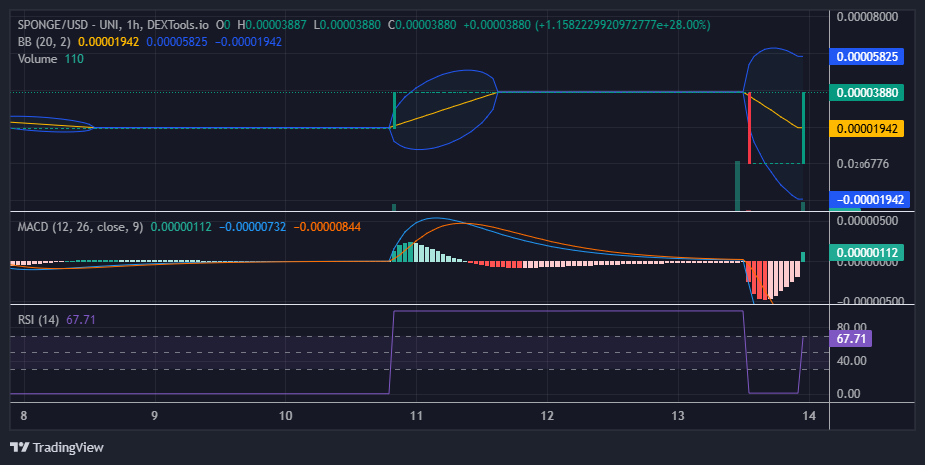
$SPONGE 1-Hour Chart Observations
The Moving Average Convergence and Divergence (MACD) indicator highlights the gradual shift in the SPONGE/USD market sentiment, as the fading red histograms indicate a steady decline in bearish pressure. However, traders have grown cautious as the price approaches the $0.000039 level, given the past rejection at this resistance. This hesitation is reflected in the ongoing bullish candlesticks, where the trading volume histogram appears relatively smaller compared to the size of the bullish candles. Nevertheless, if buyers can maintain market momentum at this level, they stand a strong chance of breaking out and sustaining a bullish trend.
Buy $SPONGE!
This one for all the bears pic.twitter.com/oUhomULjpS
— $SPONGE (@spongeoneth) February 3, 2025
Join the SPONGE community and be part of the next big crypto sensation! Buy Sponge ($SPONGE) today!