ether.fi (ETHFI/USD) Bulls Hold Firm at $1.30 Amid Rising Volatility
Estimated Reading Time: 3 minutes
Don’t invest unless you’re prepared to lose all the money you invest. This is a high-risk investment and you are unlikely to be protected if something goes wrong. Take 2 minutes to learn more

The ether.fi (ETHFI/USD) market has seen a strong bullish rally, rising sharply from the $0.50 level. This impressive uptrend was driven by growing bullish momentum as buyers regained control of the market. However, the rapid breakout introduced heightened volatility, raising the potential for increased bearish pressure near higher resistance zones.
Contrary to expectations of an immediate correction, the price is currently holding steady around the $1.30 level. This crypto signal suggests that bulls are showing resilience, successfully defending this key support despite mounting pressure and signs that the market may be due for a short-term pullback.
As long as ETHFI/USD maintains its position above $1.30, the bullish outlook remains intact, though traders should stay alert for potential shifts in momentum.
either.fi Market Data
- ETHFI/USD Price Now: $1.40
- ETHFI/USD Market Cap: $381.85 million
- ETHFI/USD Circulating Supply: 277.9 million ETHFI
- ETHFI/USD Total Supply: 1 billion ETHFI
- ETHFI/USD CoinMarketCap Ranking: #146
Key Levels
- Resistance: $1.50, $1.55 and $1.60
- Support: $1.20, $1.10, and $1.00
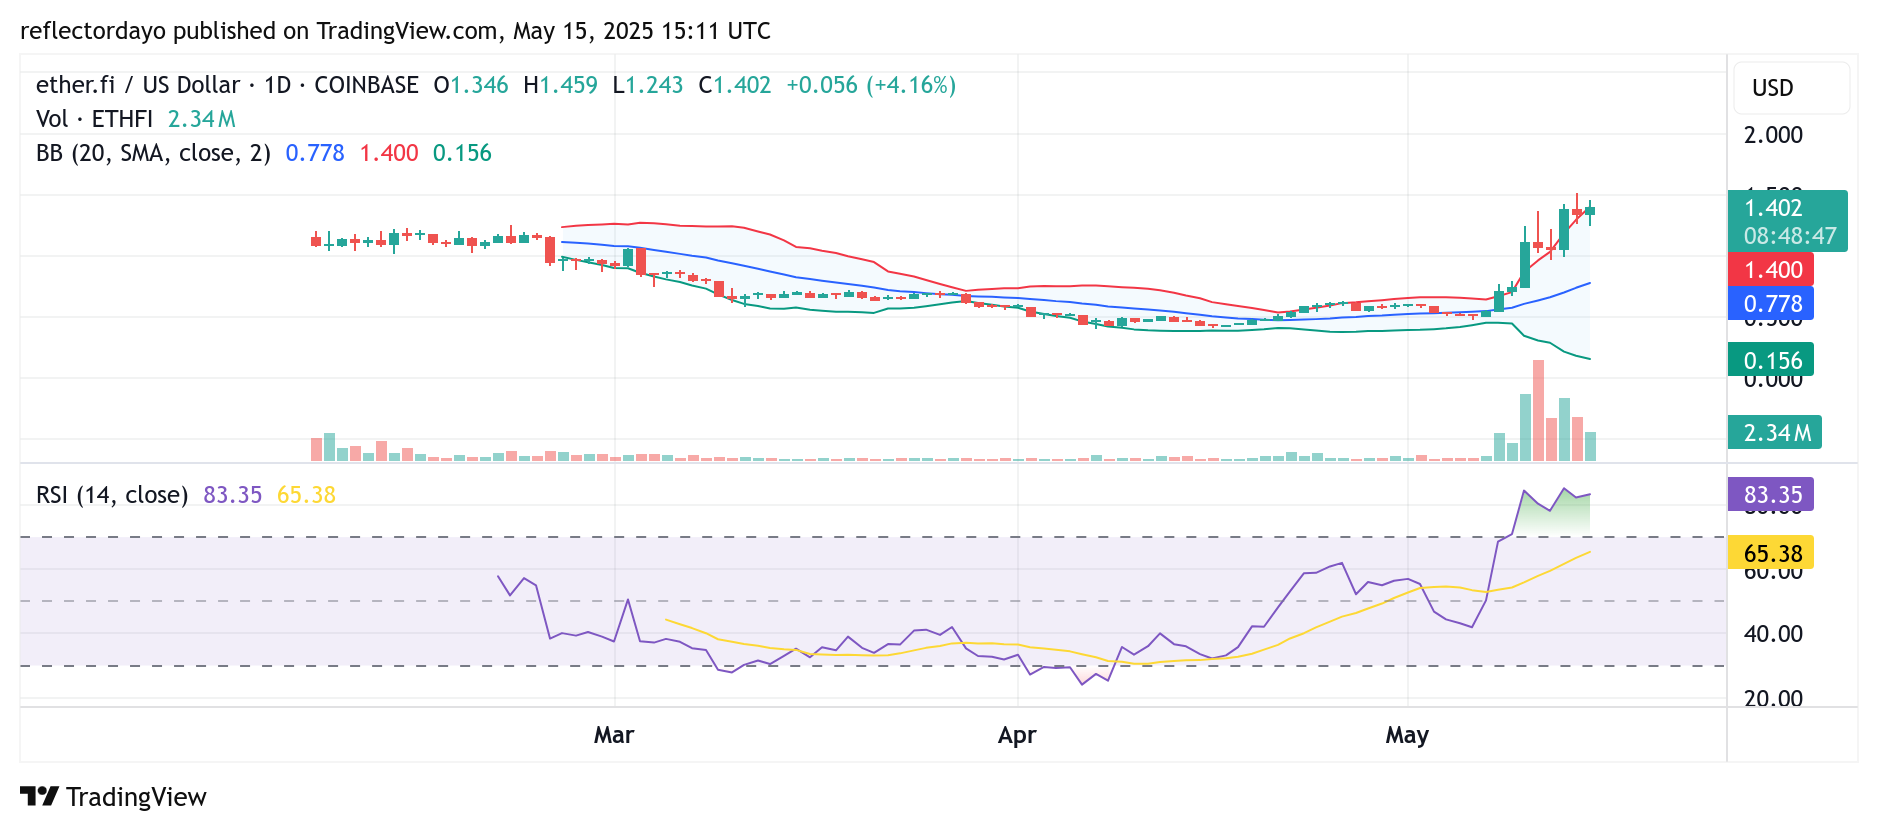
Ether.fi (ETHFI/USD) Technical Analysis: Bulls Show Resilience Amid Correction Risks
The Relative Strength Index (RSI) currently shows ether.fi trading in overbought territory, signaling that the recent bullish momentum may be approaching exhaustion. Although the RSI line remains elevated, indicating persistent buying pressure, it also suggests the growing risk of a potential correction—especially given the heightened market volatility.
This volatility is further illustrated by the widening bands of the Bollinger Bands indicator, which often precedes sharp price swings. Despite these cautionary signals, bullish traders are still holding ground near key resistance levels, anticipating a possible continuation of the upward trend.
However, a noticeable decline in trading volume suggests growing hesitation among market participants, as caution begins to take hold. If buying interest doesn’t regain strength soon, a pullback may be imminent.
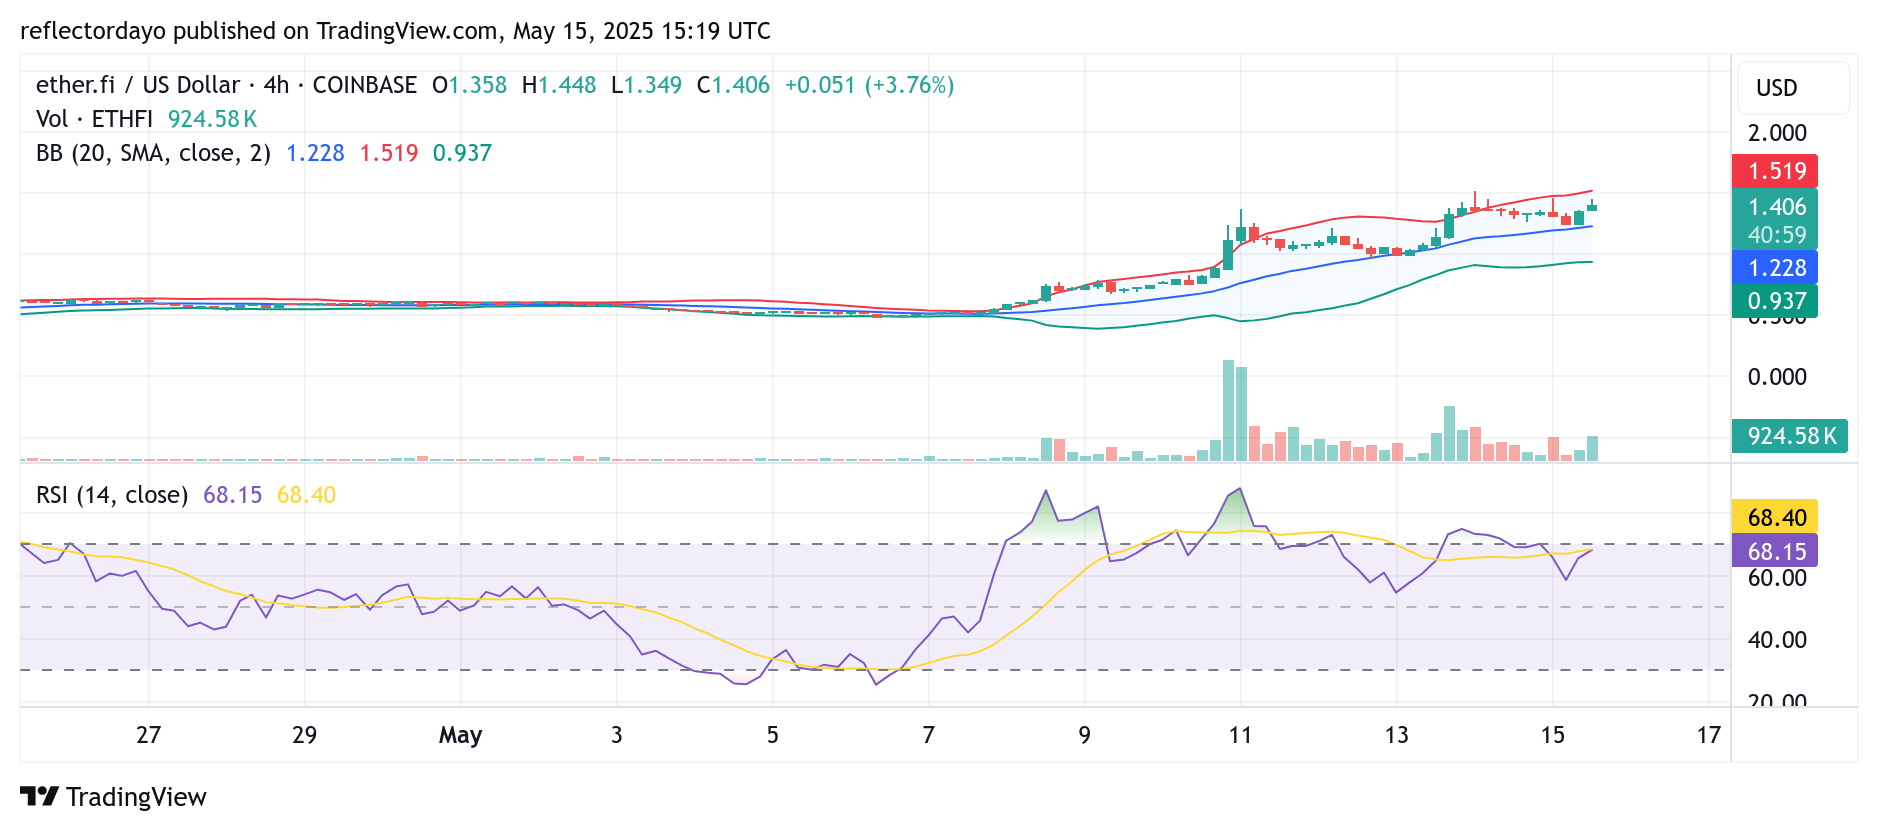
ETHFI/USD 4-Hour Chart: Market Consolidates Between $1.30 and $1.50 as Bulls and Bears Hold Key Levels
On the 4-hour chart, Ether.fi (ETHFI/USD) is showing signs of consolidation, with price action stabilizing around the $1.30 support level after encountering resistance at $1.50. This development suggests the emergence of a well-defined trading range, with bulls defending the lower boundary at $1.30 and bears pushing back at the upper boundary near $1.50.
As both sides maintain their respective positions, the market appears to be entering a consolidation phase at this elevated price range. The current standoff has led to a noticeable decline in trading volume, reflecting trader indecision as participants await a breakout in either direction.
With eyes now fixed on the $1.30 and $1.50 levels, a decisive move beyond this range could set the tone for ETHFI’s next major trend.