Raydium (RAY/USD) Faces Resistance as Bullish Recovery Stalls Near $4.00
Estimated Reading Time: 3 minutes
Don’t invest unless you’re prepared to lose all the money you invest. This is a high-risk investment and you are unlikely to be protected if something goes wrong. Take 2 minutes to learn more

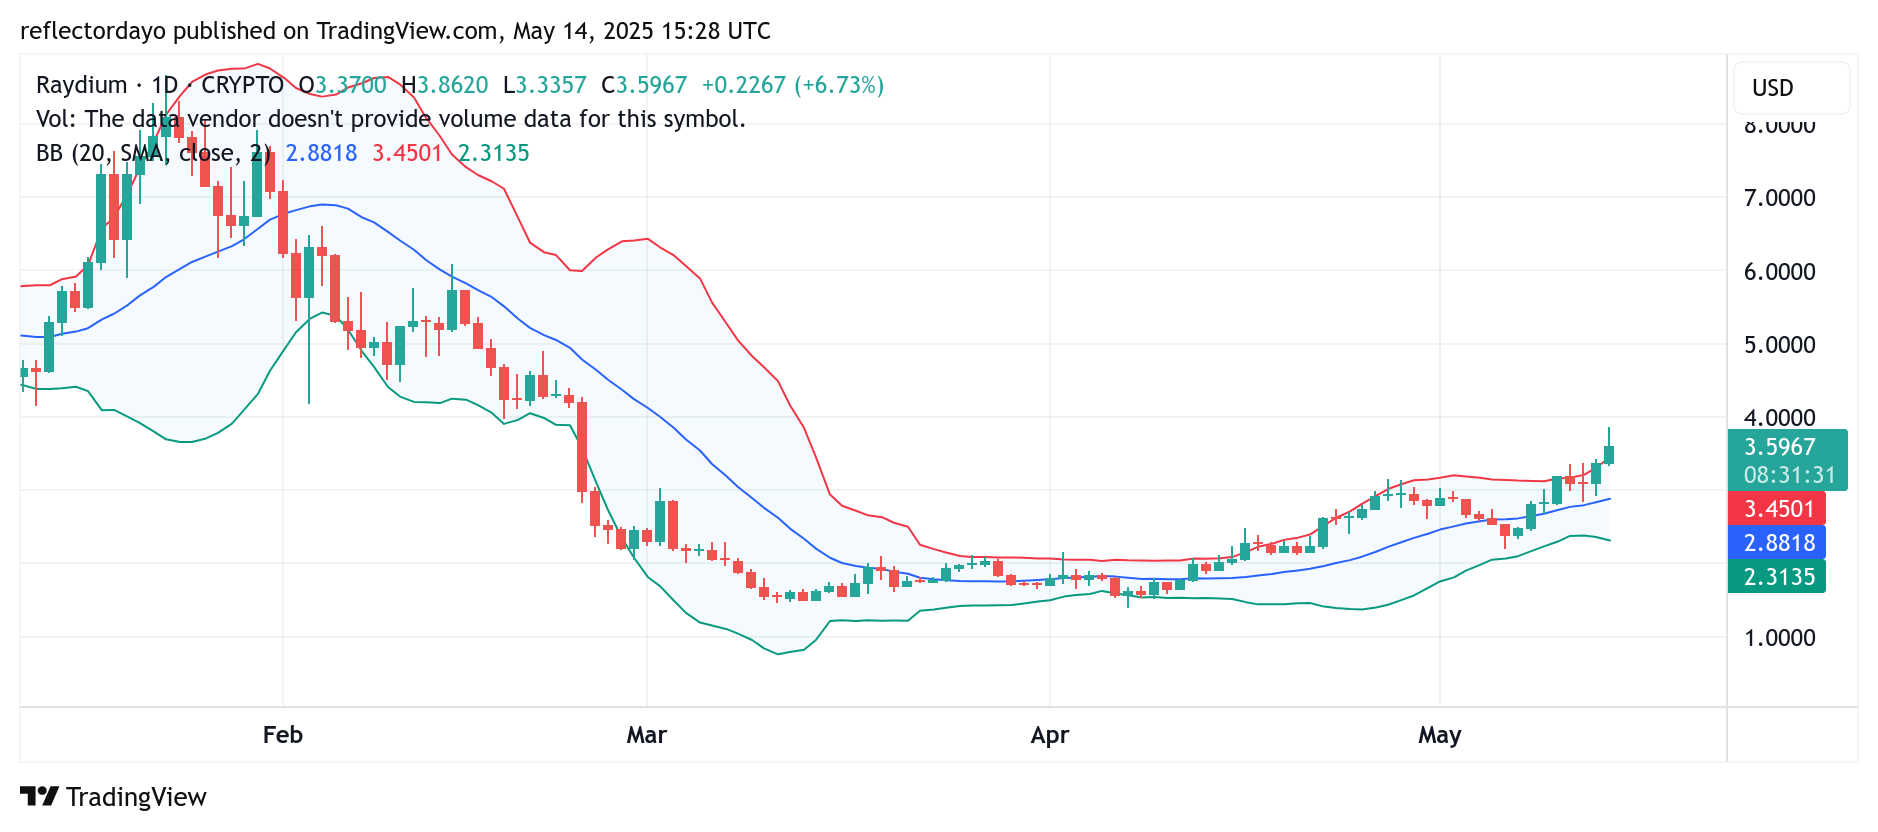
Raydium (RAY/USD) recently demonstrated a strong bullish recovery, but this momentum is now encountering resistance at the $4.00 price level. During the current daily trading session, bullish sentiment initially propelled the market from the $3.00 level toward $4.00, continuing a steady upward trend that began in April from around $1.50.
The successful break above the $3.00 threshold earlier this May highlighted growing bullish control. However, the rally appears to be losing steam as selling pressure emerges near $4.00—likely due to profit-taking from traders who entered the market during the earlier stages of the recovery. This selling activity has led to a temporary rejection at this key resistance zone, putting the continuation of the bullish trend into question.
Raydium Market Data
- RAY/USD Price Now: $3.57
- RAY/USD Market Cap: $1 billion
- RAY/USD Circulating Supply: 290 million RAY
- RAY/USD Total Supply: 554 million RAY
- RAY/USD CoinMarketCap Ranking: #77
Key Levels
- Resistance: $4.00, $5.00 and $6.00
- Support: $2.00, $1.50, and $1.00
Raydium (RAY/USD) Technical Analysis: Overbought Signals Suggest Imminent Correction
The Bollinger Bands indicate mild volatility in the Raydium market while also signaling that the earlier bullish activity in today’s session has pushed the price into overbought territory. The current price action has moved beyond the upper Bollinger Band—a classic indication that a correction may be forthcoming.
Should a pullback occur, the $3.30 level emerges as a likely rebound zone. Previously acting as resistance, this level has now flipped into a potential support area. Traders may view this point as a viable reentry opportunity, which could help maintain the broader upward trajectory in the market.

RAY/USD 4-Hour Chart: Sellers Gain Marginal Ground as Market Tests $3.50 Support
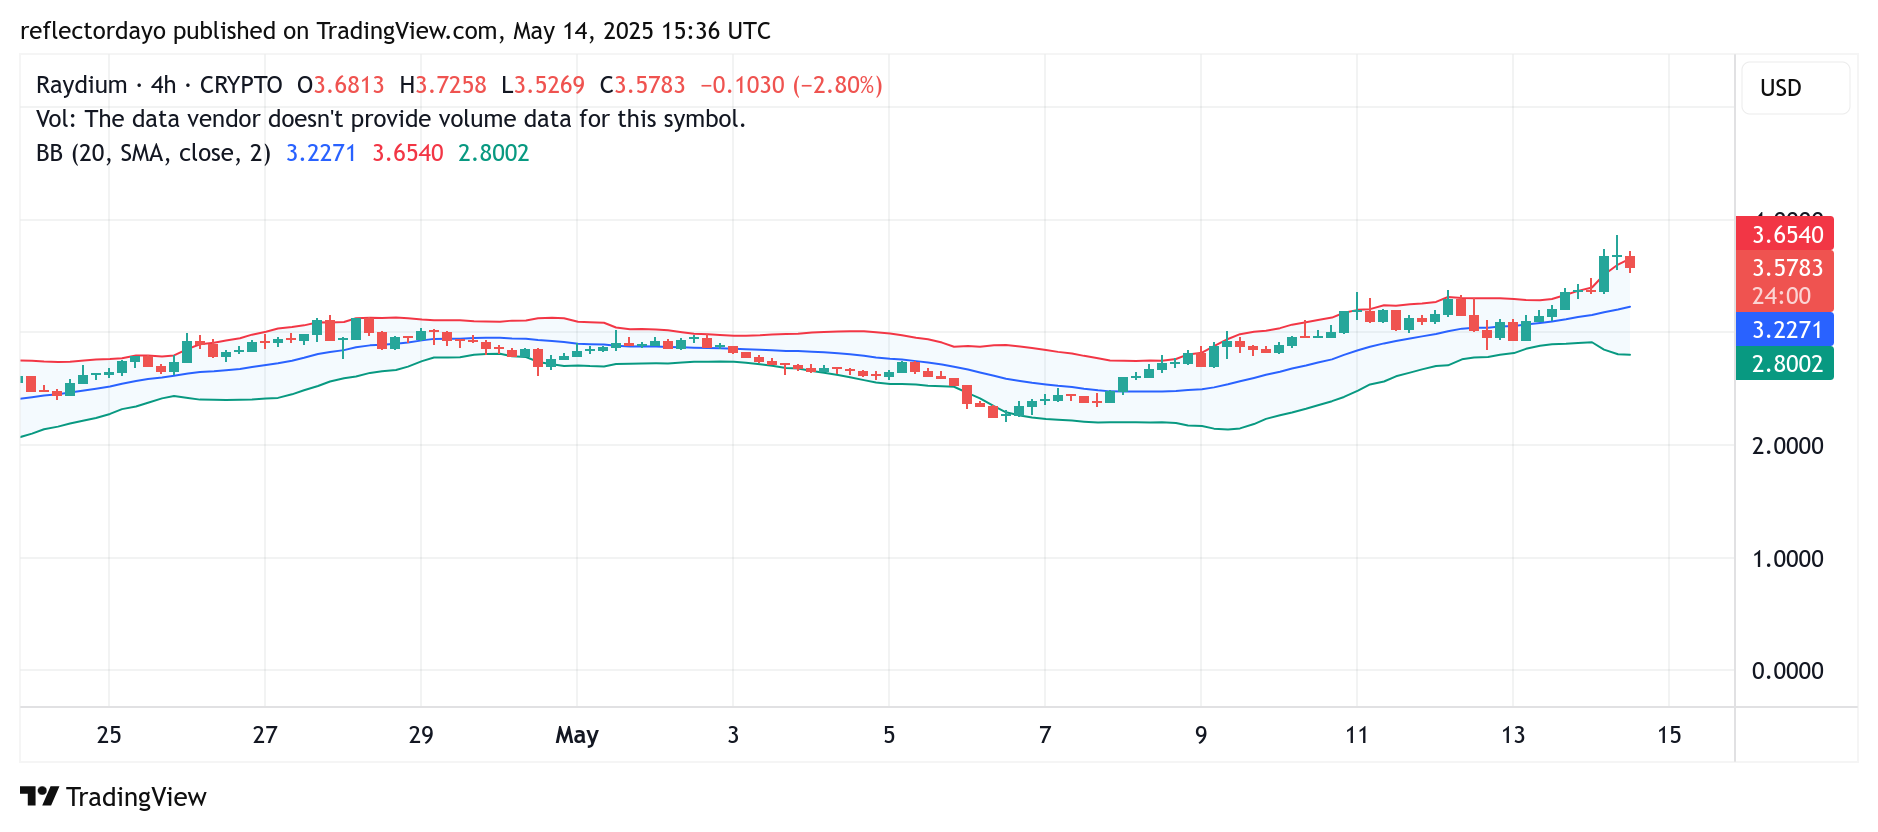
The previous 1-hour trading session revealed a strong standoff between bulls and bears, resulting in price stagnation around the $3.60 level. However, in the current 4-hour session, the market has edged lower, forming a small-bodied bearish candlestick—indicating a minor advantage for sellers.
At present, the price is attempting to stabilize around the $3.50 level. If bearish momentum persists and sellers take control, the $3.30 level—formerly a key resistance—could serve as a new support zone and potential reentry point for bullish traders anticipating a rebound.