Chainlink Breaks Initial Resistance as It Revisits the $6.00 High
Estimated Reading Time: 3 minutes
Don’t invest unless you’re prepared to lose all the money you invest. This is a high-risk investment and you are unlikely to be protected if something goes wrong. Take 2 minutes to learn more
Chainlink (LINK) Long-Term Analysis: Bearish
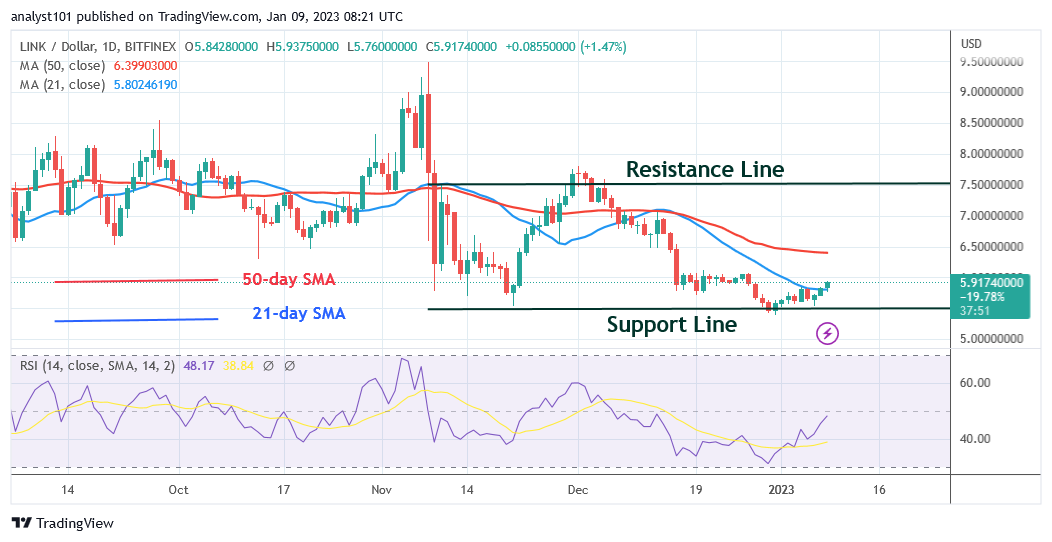
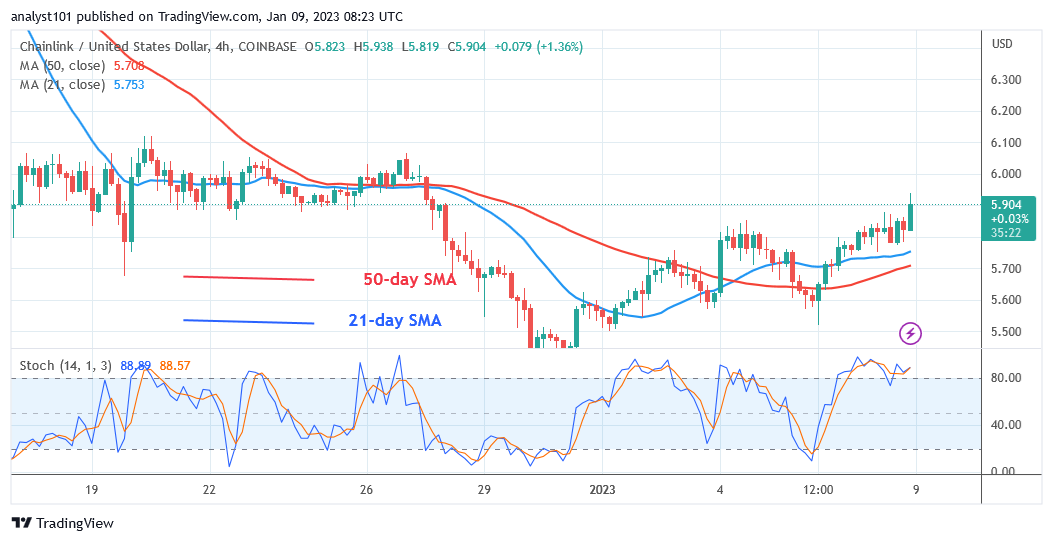
Chainlink (LINK) is currently in a bearish trend zone as it revisits the $6.00 high. Currently, the price of the cryptocurrency has risen above the $5.77 resistance level, which served as a support earlier. Additionally, it has broken through the 21-day SMA. Buyers have not yet managed to keep the price above either the $6.00 resistance level or the 50-day SMA. Since December 16, the moving average lines or the resistance at $6.00 have held back the upward movements. On the upside, Chainlink will ascend above the 50-day line SMA if it breaks through the resistance at $6.00. The bullish trend will continue up to the $7.50 high. The bullish scenario is probably invalidated, though, because the cryptocurrency is currently trading in the overbought area of the market. The altcoin might be rejected at the most recent high and retest the $5.42 low.
Chainlink (LINK) Indicator Analysis
Chainlink’s Relative Strength Index is at level 47 for period 14. The most recent upward correction has caused the RSI to rise. The price bars are located between the moving average lines, which suggest that the cryptocurrency may move in a range. The price of LINK has crossed the daily Stochastic’s overbought zone, which is located above level 80.
Technical indicators:
Major Resistance Levels – $18.00, $20.00, $22.00
Major Support Levels – $8.00, $6.00, $4.00
What Is the Next Direction for Chainlink (LINK)?
On the 4-hour chart, Chainlink is trading above the moving average lines as it revisits the $6.00 high. The overbought area of the market is where the altcoin is currently trading. The $6.00 resistance level for cryptocurrencies is getting closer. As the market enters the overbought zone, the upward movement may be rejected as the most recent high.
You can purchase crypto coins here. Buy LBLOCK
Note: Cryptosignals.org is not a financial advisor. Do your research before investing your funds in any financial asset or presented product or event. We are not responsible for your investing results