$SPONGE (SPONGE/USD) Bullish Resurgence at $0.0004539 Signals Intent to Break the Deadlock
Estimated Reading Time: 3 minutes
Don’t invest unless you’re prepared to lose all the money you invest. This is a high-risk investment and you are unlikely to be protected if something goes wrong. Take 2 minutes to learn more
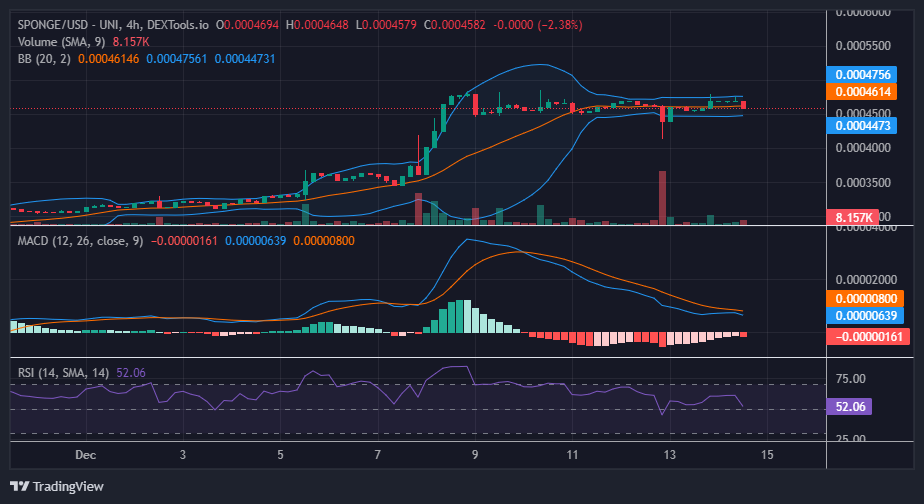
Bullish momentum for SPONGE/USD appears to be recovering around $0.0004539, signaling an intention to propel the price towards the $0.0005 level. During the fourth and fifth 4-hour sessions of yesterday’s market, bullish strength emerged, aiming to reach the $0.0005 price level. However, a cluster of bearish activity above the $0.00047 price level curtailed the bullish movement. The discernible upper shadow on the candle representing the fifth 4-hour session serves as evidence of a bearish presence in this area.
Critical Price Levels:
- Resistance: $0.00047, $0.00050, and $0.00060.
- Support: $0.000350, $0.00030, and $0.00025.
Technical Insights for $SPONGE (SPONGE/USD) Price Analysis:
As the SPONGE/USD market currently retraces towards the $0.0004539 price level, the point of origin for the last bullish movement, there is optimism that this time the resistance above the $0.00047 price level may be overcome.
Analysis based on the Bollinger Bands and the Relative Strength Index suggests a sideways-ranging market. The observed price swings are confined within a range-bound channel, with the current price holding steady at approximately $0.0004643. This level may serve as pivotal support for the anticipated bullish move. Conversely, in the Moving Average Convergence and Divergence (MACD) indicator, the two MACD lines, previously above the zero level, are now descending, although the histograms remain short. There is a possibility that the lines may converge with the histograms at the zero level, confirming the consolidation trend.
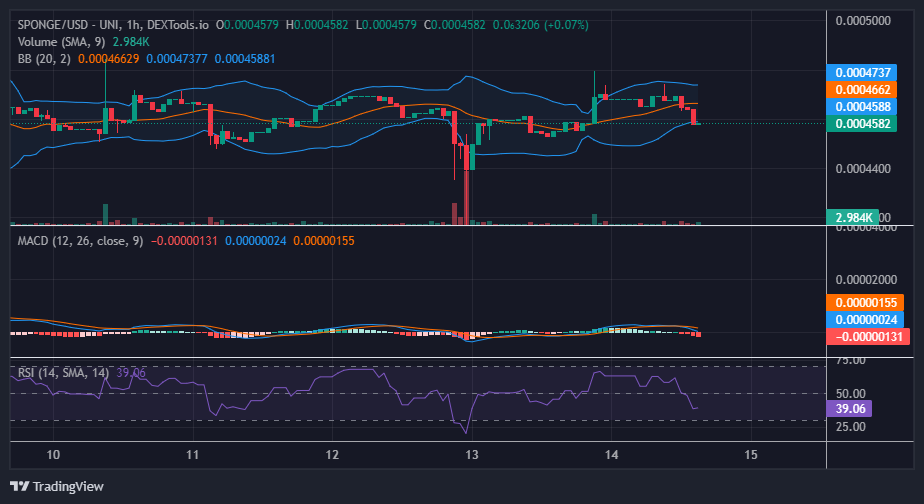
Short-Term Outlook on the 1-Hour Chart:
Within this narrow price channel, a notable downtrend is observed, with the Relative Strength Index currently registering bearish momentum around 39. As the price SPONGE/USD approaches proximity to the primary support level, there is a discernible reduction in bearish momentum, suggesting the market may be poised for a potential rally. This time, there is optimism that the bulls may successfully break the deadlock, propelling the market into a higher price zone.
Buy SPONGE/USD!
Don’t have enough $SPONGE, anon? 🧽🧽🧽🧽#SPONGE #Crypto #MemeCoin pic.twitter.com/txq5jHYJx9
— $SPONGE (@spongeoneth) December 14, 2023
Invest in the hottest and best meme coin. Buy Sponge ($SPONGE) today!