Chainlink Risks Decline if It Faces Rejection at the $6.00 High
Estimated Reading Time: 2 minutes
Don’t invest unless you’re prepared to lose all the money you invest. This is a high-risk investment and you are unlikely to be protected if something goes wrong. Take 2 minutes to learn more
Chainlink (LINK) Long-Term Analysis: Bearish
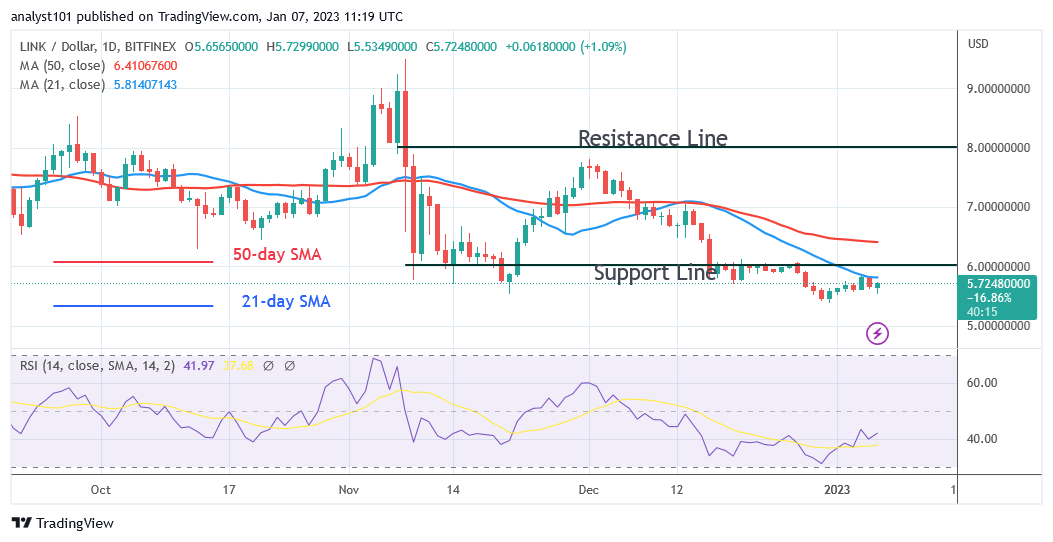
Chainlink (LINK) is declining and is currently trading as it faces rejection at the $6.00 high. As it struggles to break above the 21-day line SMA, the cryptocurrency asset runs the risk of declining. On December 30, when the price had dropped to a low of $5.42, Chainlink began to rise again as it approached the moving average lines. To remain above the moving average lines, buyers have been aggressive. On the plus side, if the price of the cryptocurrency crosses above the moving average lines or the resistance at $6.00, Chainlink will rise to its previous high of $8.00. Chainlink will drop even further, to a low of $3.92 or $4.00, if it is rejected at the most recent high. The altcoin most recently rose to $5.78.
Chainlink (LINK) Indicator Analysis
Chainlink’s Relative Strength Index for period 14 is 39. The most recent upward movement has caused the LINK price to increase. Despite this, the altcoin is in a bearish trend zone and could continue to decline. The moving average line is below the price bars, which suggests a potential decline. When the daily Stochastic is above level 40, the cryptocurrency is in a bullish trend.
Technical indicators:
Major Resistance Levels – $18.00, $20.00, $22.00
Major Support Levels – $8.00, $6.00, $4.00
What Is the Next Direction for Chainlink (LINK)?
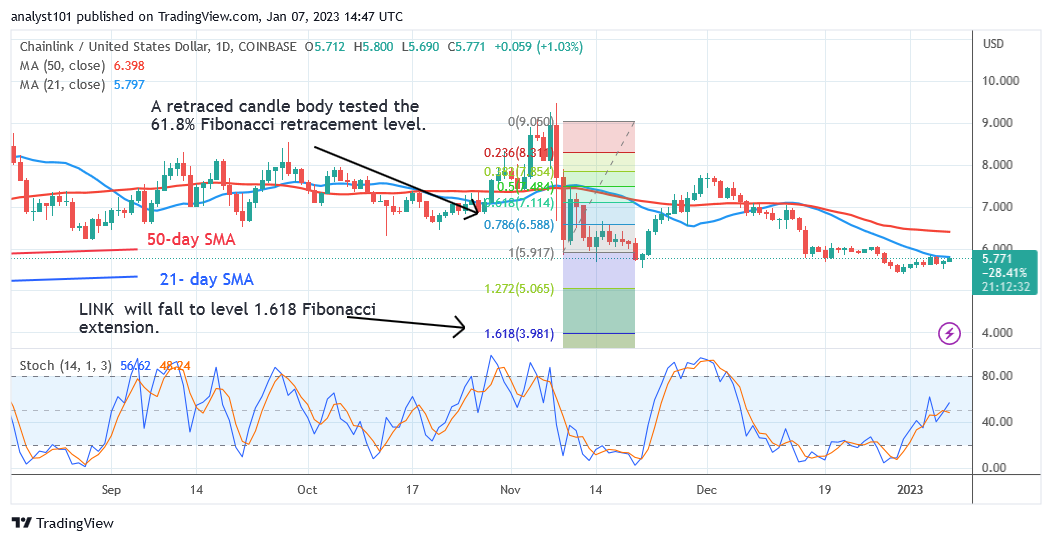
Another potential decline in chainlink is getting closer as it faces rejection at the $6.00 high. The current structure has already failed. The moving average lines are rejecting the upward correction. The Fibonacci tool predicts that the cryptocurrency will continue to fall. If the current support is broken, the selling pressure will increase until $3.98.
You can purchase crypto coins here. Buy LBLOCK
Note: Cryptosignals.org is not a financial advisor. Do your research before investing your funds in any financial asset or presented product or event. We are not responsible for your investing results