Polkadot Resumes Positive Momentum but Faces the $5 Hurdle
Estimated Reading Time: 2 minutes
Don’t invest unless you’re prepared to lose all the money you invest. This is a high-risk investment and you are unlikely to be protected if something goes wrong. Take 2 minutes to learn more

Polkadot (DOT) Long-Term Analysis: Bullish
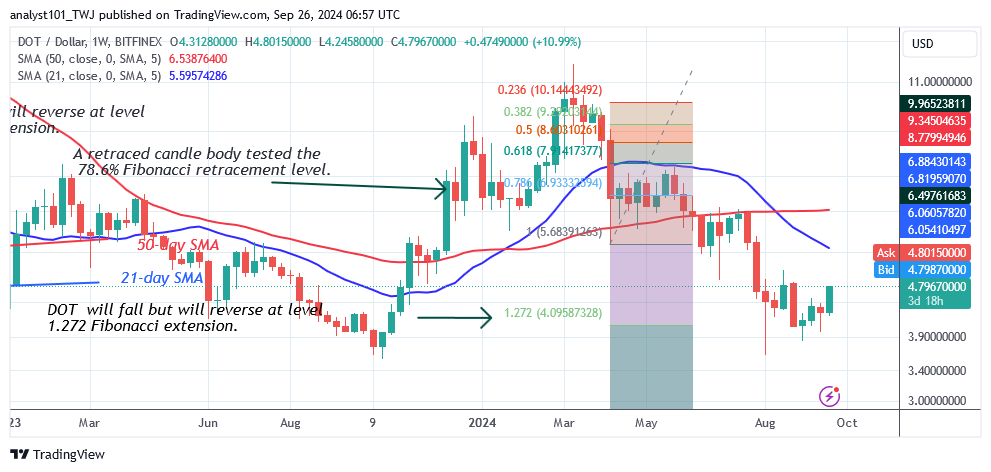
Polkadot’s (DOT) price is making positive moves but faces the $5 hurdle. DOT price is rising though it is trading within its price range. The altcoin has been trading above the $4.00 but below the $5.00 resistance since August 6. Today, the altcoin is rising as it approaches the resistance at $5.00. According to the price indication, the DOT price is predicted to hit a high of $5.80 if the current resistance level is broken.
Furthermore, if the current bullish momentum continues, the altcoin will surge to a high of $6.50. However, if the bulls fail to break above the current resistance level, the DOT price will resume its range-bound trend. The altcoin is now worth $4.79.
Technical indicators:
Major Resistance Levels – $10, $12, $14
Major Support Levels – $8, $6, $4
Polkadot (DOT) Indicator Analysis
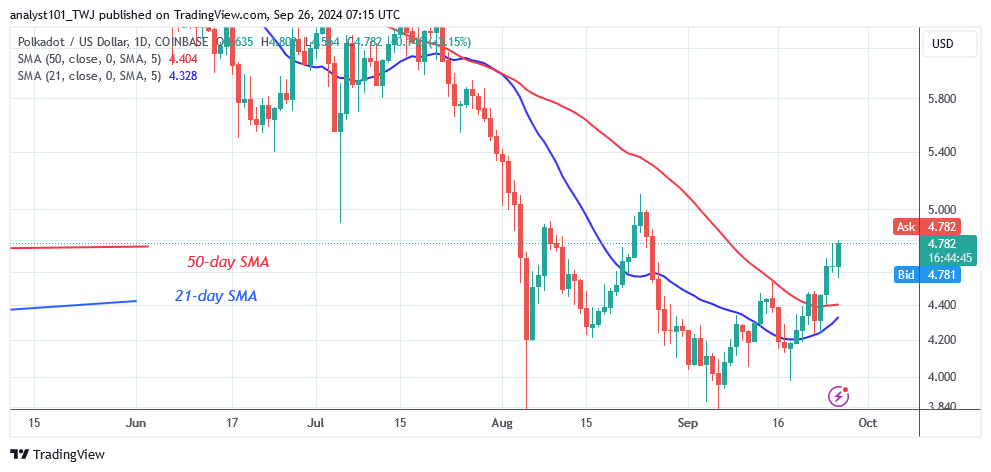
On the daily chart, the price of cryptocurrency has fluctuated below and above the moving averages. Today, the price bars are above the moving average lines, having rallied to the barrier at S5.00. When the price breaches the present support and resistance levels, the market will begin to trend.
What Is the Next Direction for Polkadot (DOT)?
Polkadot price has recovered positive momentum but faces the $5 hurdle. Since August 6, DOT prices have been trading between $4.00 and $5.00.The DOT price rises as it attempts to break through the resistance at $5.00. This will be the third time the bulls have attempted to breach the resistance level. If buyers succeed, the altcoin will reach a high of $5.80. Otherwise, the sideways trend will last indefinitely. The cryptocurrency signal is good because the price has broken above the moving average lines.
You can purchase Lucky Block here. Buy LBLOCK
Note: Cryptosignals.org is not a financial advisor. Do your research before investing your funds in any financial asset or presented product or event. We are not responsible for your investing results.