Polkadot Restarts Its Bullish Trend as It Meets the $5.10 Hurdle
Estimated Reading Time: 2 minutes
Don’t invest unless you’re prepared to lose all the money you invest. This is a high-risk investment and you are unlikely to be protected if something goes wrong. Take 2 minutes to learn more
Polkadot (DOT) Long-Term Analysis: Bearish
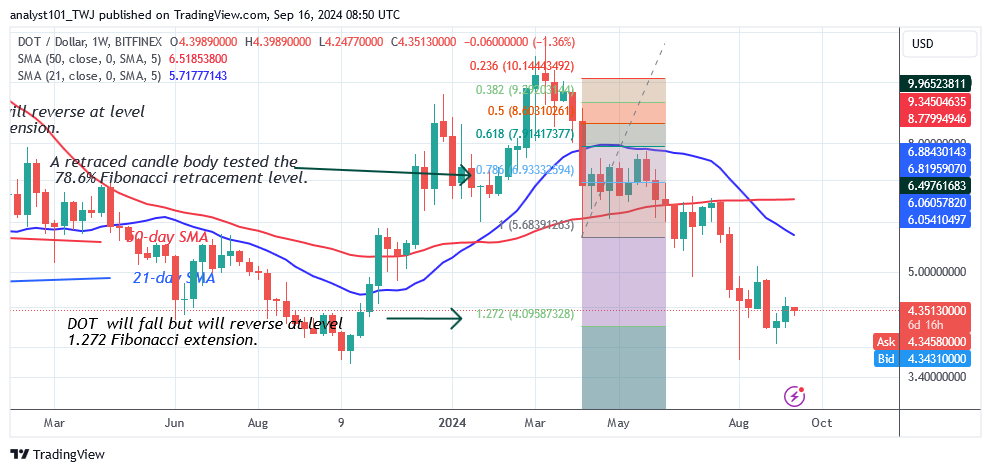
Polkadot’s (DOT) price is in a range-bound move above $4.00 as it meets the $5.10 hurdle. The cryptocurrency asset has recovered from its downturn but has yet to restart a bullish trend. Polkadot has been forced to begin an upward retracement, resulting in the altcoin testing the resistance level twice. The altcoin has been trading above the $4.00 support but below the moving average lines or the $5.10 resistance level.
When the hurdles are breached, the altcoin will resume its bullish path. Currently, the DOT price is caught between the moving average lines. On the upside, a break above the 50-day SMA will propel the altcoin to a high of $6.50. The altcoin will eventually rebound from its present sideways trend. If the bullish scenario is invalidated, the sideways trend will continue.
Technical indicators:
Major Resistance Levels – $10, $12, $14
Major Support Levels – $8, $6, $4
Polkadot (DOT) Indicator Analysis
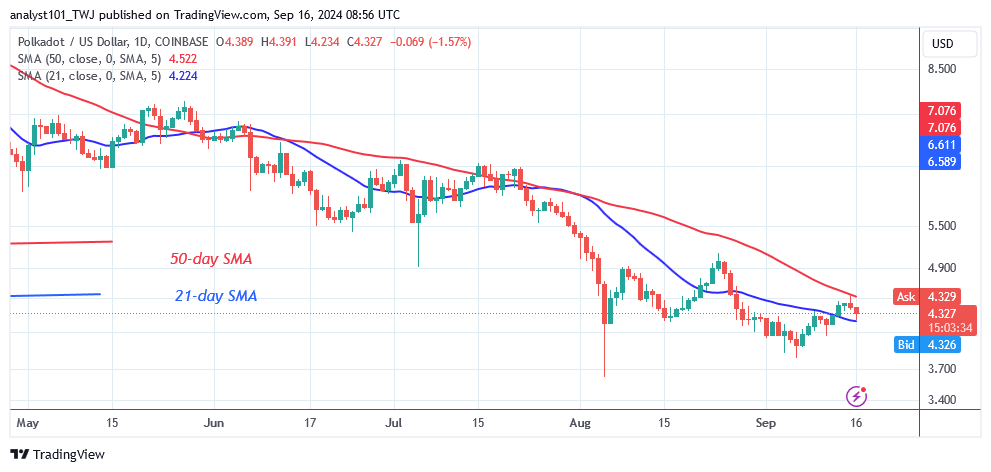
Following the recent price rally, the DOT price is trading between the moving average lines. For the next few days, the altcoin will be limited between the moving average lines. When the moving averages are breached, the altcoin will trend. The DOT price is decreasing following rejection by the 50-day SMA.
What Is the Next Direction for Polkadot (DOT)?
Polkadot price is reverting as it meets the $5.10 hurdle. The price movement has been limited to above the $4.00 level and below the moving average lines. If the 21-day SMA support is breached, the cryptocurrency will return to its crucial support level of $4.00. Meanwhile, the altcoin is caught between the moving average lines, limiting the crypto signal’s range.
You can purchase Lucky Block here. Buy LBLOCK
Note: Cryptosignals.org is not a financial advisor. Do your research before investing your funds in any financial asset or presented product or event. We are not responsible for your investing results.