Polkadot Finds Support at $4.00 for a Potential Uptrend
Estimated Reading Time: 2 minutes
Don’t invest unless you’re prepared to lose all the money you invest. This is a high-risk investment and you are unlikely to be protected if something goes wrong. Take 2 minutes to learn more

Polkadot (DOT) Long-Term Analysis: Bearish
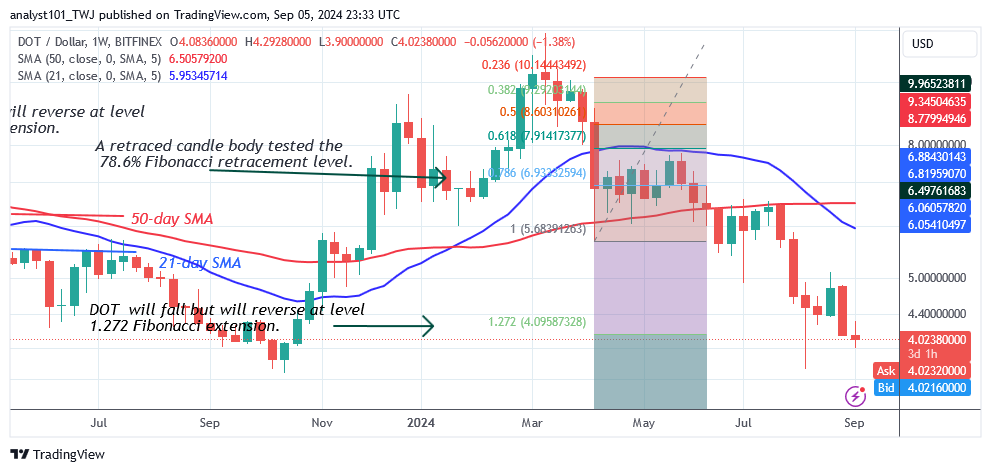
Polkadot’s (DOT) price has reached bearish exhaustion as it dropped to a low of $3.61 for a potential uptrend. The fall on August 5 exceeded the projected price of $4.00. Since August 5, the price movement has halted above $4.00, and the altcoin has begun a sideways move above the $4.00 support but below the moving average lines or resistance at $5.10.
On the upside, buyers attempted and retested the barrier twice but were turned down. Polkadot is currently priced at $4.00. On the downside, the price indicator predicts a possible decline and reversal at the 1.272 Fibonacci extension, or $4.09. Today, the DOT price is $4.05, consolidating for a potential upward move.
Technical indicators:
Major Resistance Levels – $10, $12, $14
Major Support Levels – $8, $6, $4
Polkadot (DOT) Indicator Analysis
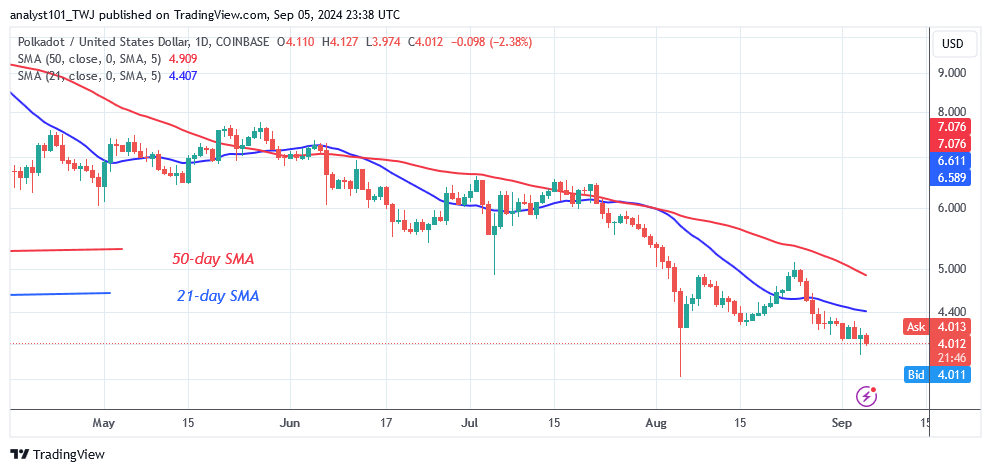
The moving average lines are trending downward, indicating a bearish crossover. The bearish crossover suggests that the cryptocurrency will face increased selling pressure. The selling pressure subsided as it reached the bottom of the chart. The altcoin has reached the historical price level of December 26, 2022.
What Is the Next Direction for Polkadot (DOT)?
Polkadot trades in a tight range below the moving average lines for a potential uptrend. On the downside, the market has been reversing when it hits its historical price level. Today, the DOT price is climbing as it gains support over the $4.00 level. The cryptocurrency signal becomes favorable when the market gets closer to oversold territory.
You can purchase Lucky Block here. Buy LBLOCK
Note: Cryptosignals.org is not a financial advisor. Do your research before investing your funds in any financial asset or presented product or event. We are not responsible for your investing results.