Cronos (CROUSD) Is Set for an Uptrend as Buying Pressure Rises
Estimated Reading Time: 3 minutes
Don’t invest unless you’re prepared to lose all the money you invest. This is a high-risk investment and you are unlikely to be protected if something goes wrong. Take 2 minutes to learn more
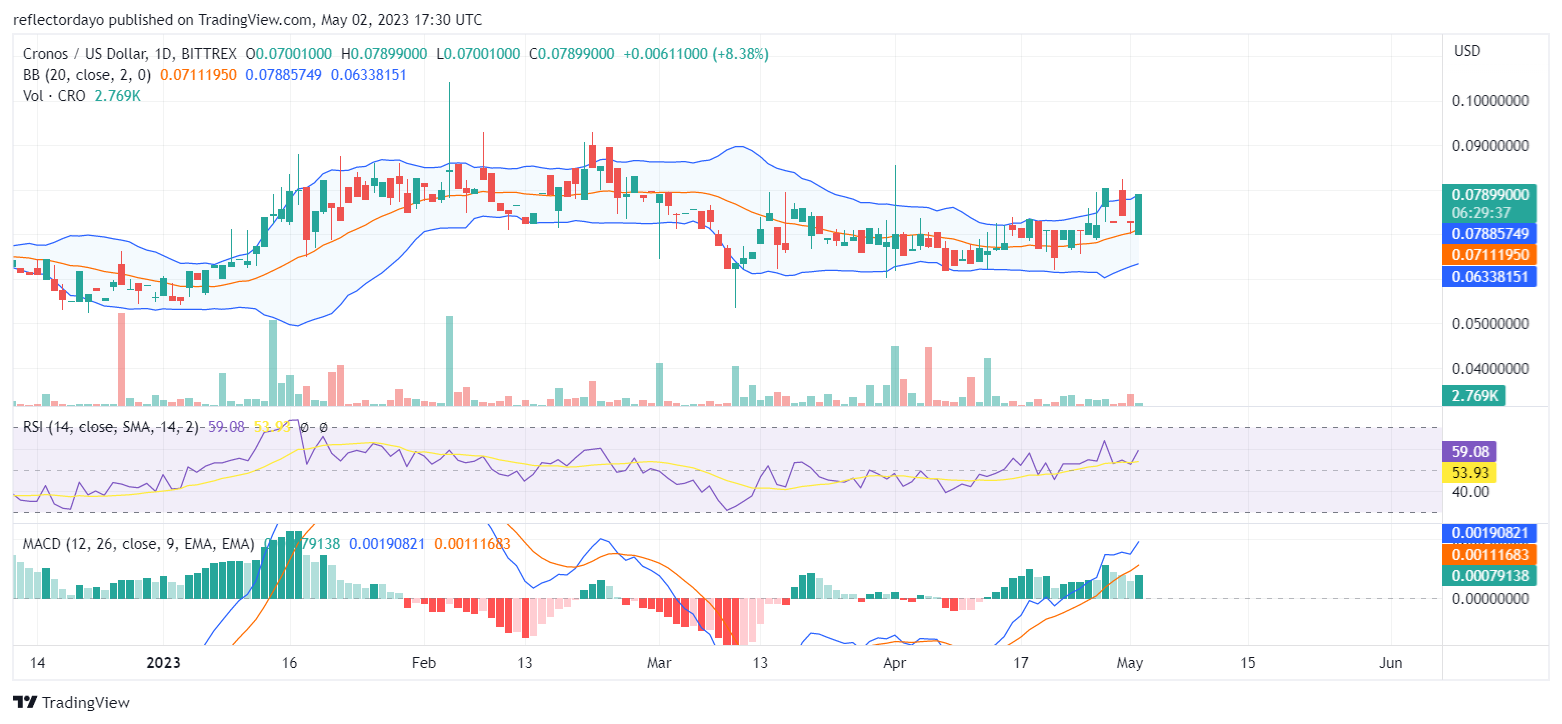
In the previous daily session, the Cronos market turned around. The day started with massive sales that brought the price to a comfortable demand level. The price came to the $0.0700 level. This was the point at which the bulls turned the market around, and the market was nearing closing in favor of the bulls. In today’s trading session, the buyers fell back to the demand level, taking it as their base and charging aggressively at the $0.08 price level.
CRO/USD Price Statistics
- CRO/USD Price Now: $0.079
- CRO/USD Market Cap: $1,822,363,300
- CRO/USD Circulating Supply: 25,263,013,692 CRO
- CRO/USD Total Supply: 30,263,013,692
- CRO/USD CoinMarketCap Ranking: #33
Key Levels
- Resistance: $0.08, $0.085, and $0.090.
- Support: $0.057, $0.050, and $0.045
Price Prediction for Cronos: The Indicators’ Point of View
The bulls are closer to achieving their target for today as the bull market is almost reaching the $0.080 price level. The appearance of a marubozu candlestick indicates one-sidedness. There is currently no sign that there could be a reversal in the direction of the market. The bulls are completely dominant in this daily session. Due to this one-sided characteristic of today’s market, the Bollinger Bands indicator did not show any sign of volatility, instead, it portrays an upward-trending price channel. Also, looking at the volume of trade indicator, it shows very few activities in comparison to the actual indication of today’s market on the chart. This may be the reason why the momentum (according to the Relative Strength Index) is not as strong as it should be when compared to how far today’s market has gone.

CRO/USD 4-Hour Chart Outlook:
Cronos is clearly trending in an upside direction when we look at the market from a 4-hour point of view. Another thing we notice from this standpoint on the market is the frequent appearance of 4-price Doji candlestick patterns. This explains the disparity between the price action and the low volume of trade for today, as the appearance of this kind of candlestick pattern is common in a market with a low volume of trade. The 4-price Doji candlestick indicates the highest level of indecision in the market. That means that at some point, traders were undecided.