SPONGE/USD ($SPONGE) May Furiously Pump at the $0.000100 Price Level
Estimated Reading Time: 2 minutes
Don’t invest unless you’re prepared to lose all the money you invest. This is a high-risk investment and you are unlikely to be protected if something goes wrong. Take 2 minutes to learn more

The SPONGE/USD market experienced a significant bullish move on August 29th, which was followed by a gradual bearish trend. This price action has had a notable impact on the Bollinger Bands, with them diverging widely from each other.
Key Levels
- Resistance: $0.000115, $0.000120, and $0.000125.
- Support: $0.00010, $0.000090, and $0.00008.
Sponge (SPONGE/USD) Price Analysis: The Indicators’ Point of View
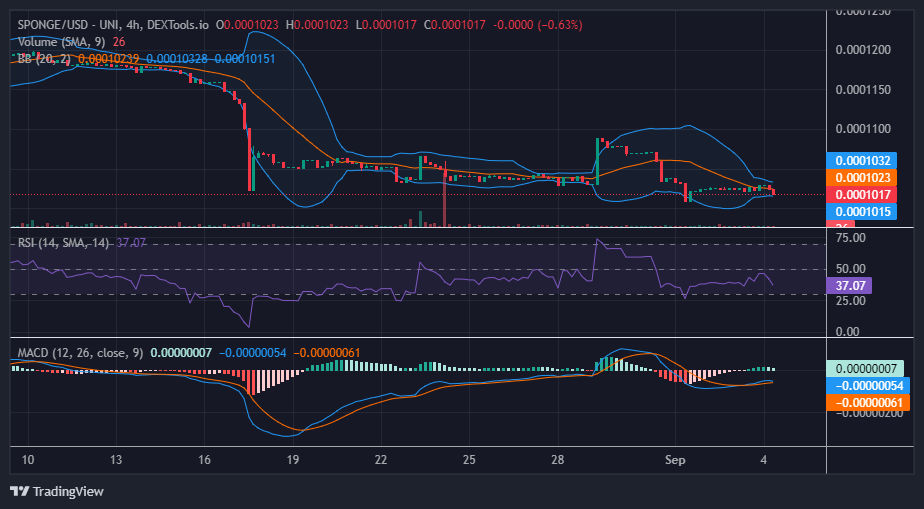
The wide divergence of the Bollinger Bands after the strong bullish move on August 29th suggests heightened volatility during that period. This divergence often indicates the presence of a strong trend, in this case, a bullish one. The subsequent bearish pressure in the market has caused the price to decline. The SPONGE/USD market is currently approaching the $0.00010 price level, which appears to be acting as a significant support level.
Notably, one could observe from the 4-hour chart that as the market move past the $0.0001030 price level, which is slightly higher than the $0.00010 support level, the Bollinger Bands are beginning to converge. This convergence suggests a potential shift in market sentiment and the reduction of market volatility.
$SPONGE Short-Term Outlook: 1-Hour Chart
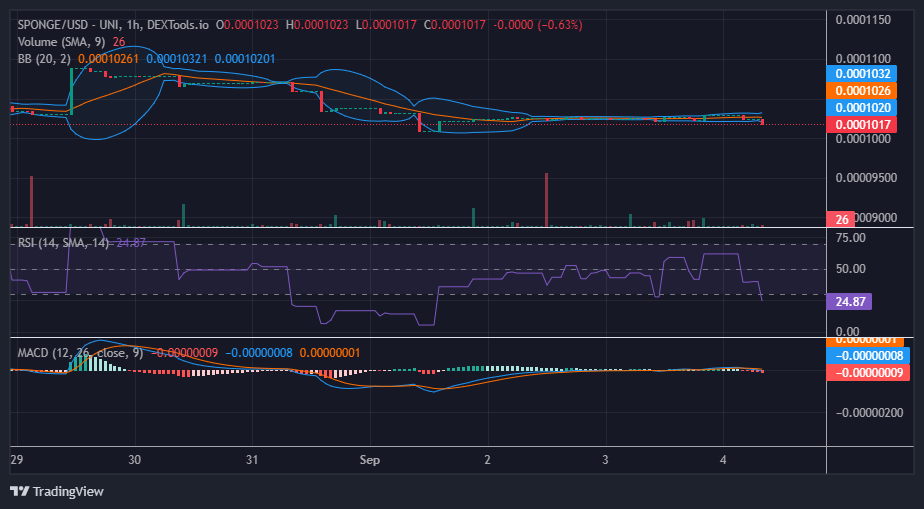
Analyzing the market from a 1-hour chart perspective, there are indications of potential pressure accumulation just below the $0.0001030 price level. This observation is supported by a noticeable increase in trading volume, as reflected by significant histograms on the volume indicator, signifying heightened investor interest. This ongoing tug-of-war between buyers and sellers within the support range of $0.0001000 to $0.0001030 raises the possibility of a forthcoming shift in market dynamics towards an upward trajectory.
Begin trading SPONGE/USD on LBANK.
🧽Greetings #SPONGERS!🌊👋
🧽Dive deep into the realm of @LBank_Exchange and embark on your trading journey with $SPONGE to absorb all the dampness!🚀💰💧
🔗 Explore more at: https://t.co/wJrs7ud3mD pic.twitter.com/xMOMlGB2U3
— $SPONGE (@spongeoneth) September 4, 2023
Invest in the hottest and best meme coin. Buy Sponge ($SPONGE) today!