Lucky Block Price Prediction: LBLOCK/USD Becomes Cheaper; Opportunity to Buy
Estimated Reading Time: 3 minutes
Don’t invest unless you’re prepared to lose all the money you invest. This is a high-risk investment and you are unlikely to be protected if something goes wrong. Take 2 minutes to learn more

Free Crypto Signals Channel
The Lucky Block price prediction drops with a loss of 0.37% as the price becomes cheaper for new buyers to come in.
LBLOCK/USD Market
Key Levels:
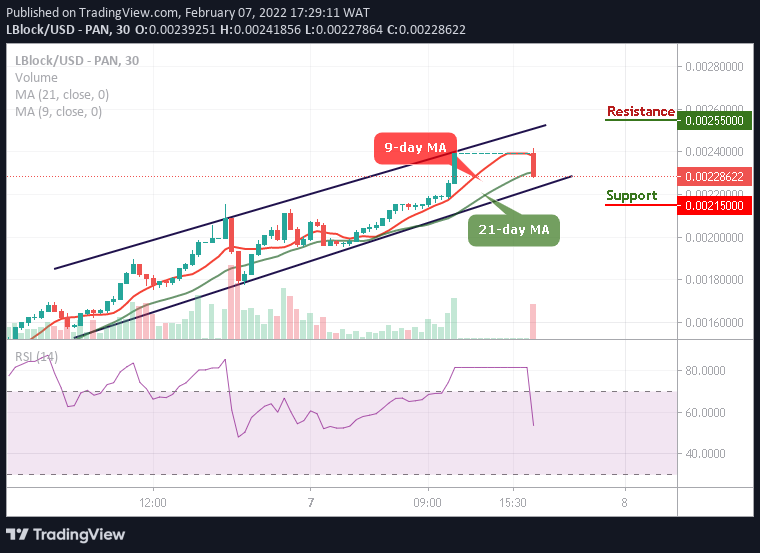
Resistance levels: $0.00255, $0.00260, $0.00265
Support levels: $0.00215, $0.00210, $0.00205
LBLOCK/USD is seen dropping towards $0.00220 and the coin can even spike below the lower boundary of the channel. Therefore, if the sellers start to push the market further lower once again, bears can expect immediate support below to be located at the $0.00216 level.
Lucky Block Price Prediction: LBLOCK Would Rebound Back to the Upside
At the time of writing, the Block Lucky price continues to drop and this could be a good opportunity for the new buyers to come into the market or allow the existing buyers to buy the dips. The coin prepares to fall more as the technical indicator Relative Strength Index (14) slides below 60-level. Beneath this, further supports may be found at $0.00215, $0.00210, and $0.00205.
Alternatively, if the buyers can hold the support at $0.00228 and begin to climb higher, the bulls can expect immediate resistance to be located at $0.00245. Above this level, higher resistance lies at $0.00255, $0.00260, and $0.00265, and the RSI (14) heads below 60-level, which shows the opportunity to buy the dips.
LBLOCK/USD Medium-term Trend: Bullish (15 Minutes Chart)
On the 15-minute chart, the LBLOCK price is facing the north. The buyers that entered the market when it touched the low at $0.00223 should now be in profit. LBLOCK/USD is trading towards the 9-day moving in order to hit the resistance level of $0.00230.
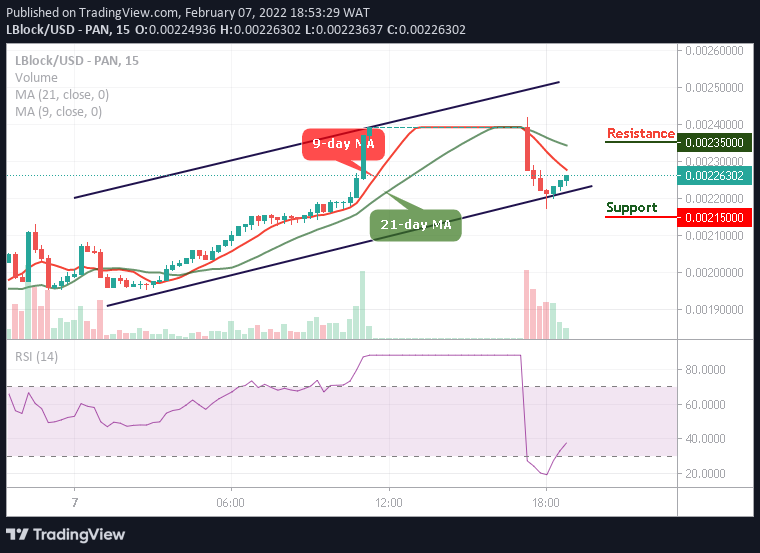
From above, if the buyers can move the price above the $0.00230 level, higher resistance lies at $0.00235 and above. Moreover, should the bulls fail to move the price above the 9-day moving average, then, another support may come at $0.00215 and below while the RSI (14) heads towards 40-level.
Read more: