XRP (XRP/USDT) Price Eyes Upward Momentum Amid Bullish Trend
Estimated Reading Time: 3 minutes
Don’t invest unless you’re prepared to lose all the money you invest. This is a high-risk investment and you are unlikely to be protected if something goes wrong. Take 2 minutes to learn more

In the last 24 hours, the value of XRP against Tether has risen significantly above 1.0%, with more than a 10% weekly gain despite general market bias. As it stands, the token has recorded an amended version of the ETF application by Canary Capital, fresh bullish institutional moves by Evernorth, and an Indian court ruling that protects XRP as a property.
Technically, the pair appears to be operating next to a critical resistance level, and a break above this threshold will determine the next direction if the bullish participation rate is sustained.
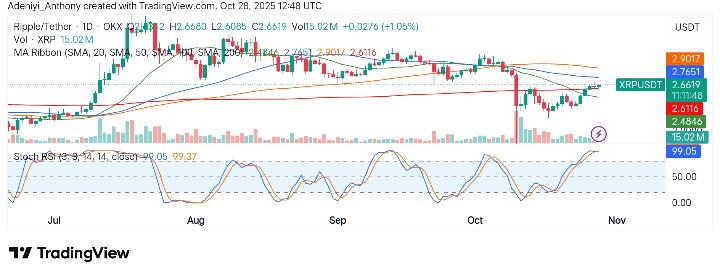
Currently, XRP trades at $2.6619 with over 15 million volume for the day and a market cap of around $159 billion.
Technical Indicators
Major Resistance Levels: $2.7652, $2.9018, and $3.2000
Major Support Levels: $2.6116, $2.4847, and $2.0000
Technical Analysis
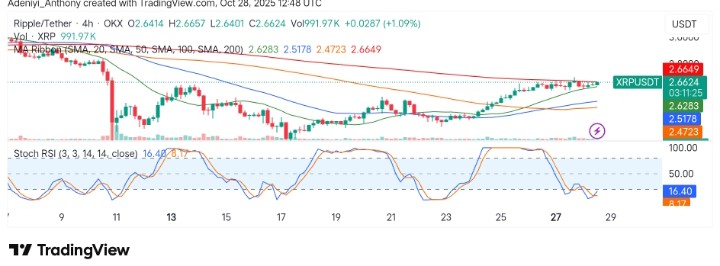
XRP against Tether on the daily timeframe displays a strong upward momentum as the price steadily propels to the north. It appears that the pair targets a spot above the moving average ribbon. As it stands, the pair’ price has successfully breached above the 20-period moving average as it aims to do likewise to the 50-period SMA.
Additionally, the Stochastic RSI appears to be showing positive momentum, indicating increasing buying pressure as the price extends towards the critical price limit. To this end, a break and a strong hold above $2.7652 would suggest a move towards $3.2000. Above all, caution is warranted.
Will XRP Increase Soon?
XRP, after several bullish indications in the crypto market in recent times, has remained around a spot, hoping for a position above $2.75 or $2.85 due to the current fundamentals. However, the possibility of a pullback before moving upside increases with time as tons of bearish divergences appear both on the daily and hourly timeframes. Moreover, volume and loss of momentum on open interest indicate that the price might retrace a little. To this end, the $2.45 support level might be the next stronghold, as a break below this level would invalidate the current opinion.
XRP/USDT Analysis: Strong Short-term Resistance Ahead: What’s Next?
On the 4-hour chart, XRP/USDT is displaying a notable recovery, with a healthy buying interest above the 100- and 50-period SMA. Meanwhile, the momentum oscillator, on the other hand, is indicating a continued upside move as the lines extend into the bullish area, testing the $2.67 resistance.
As it stands, the volume appears to support the current bullish stance, but it would be rational to expect a pullback towards $2.45 in the near term. To this end, a break below the foreseen support may attract a further dip.
You can purchase crypto coins here. Buy Crypto