XRP (XRP/USDT) Struggles Amid Market Weakness as Bearish Momentum Dominates
Estimated Reading Time: 3 minutes
Don’t invest unless you’re prepared to lose all the money you invest. This is a high-risk investment and you are unlikely to be protected if something goes wrong. Take 2 minutes to learn more
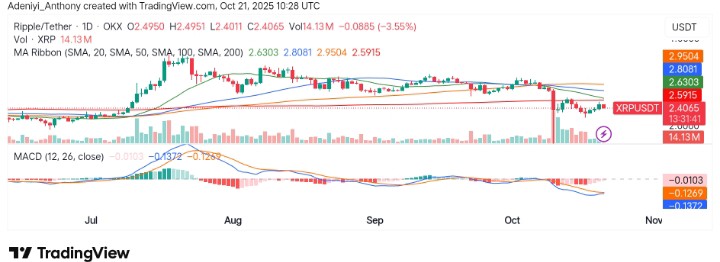
The market for XRP against Tether has recently been under pressure, with the price dropping from a high of around $2.95 to the current level around $2.4011. Meanwhile, the MA Ribbon (20, 50, 100, and 200-period SMAs) indicates that the price is below key moving averages, reflecting a bearish phase. Additionally, the MACD shows a negative divergence with the histogram in the red zone, indicating continued bearish momentum.
However, the pair has recently seen a drop accompanied by a decrease in volume. This suggests that the selling pressure may be weakening, but it is still a concern for short-term price movement.
Currently, XRP trades at $2.4065 with more than 14.13 million traded volumes for the day.
Technical Indicators
Major Resistance Levels: $2.6900, $2.7900, and $3.200
Major Support Levels: $2.4011, $2.2000, and $2.0000
Technical Analysis
Technically, XRP against Tether has seen a sharp decline of about 3.55% after opening around $2.4900, moving below the cluster of moving averages and establishing a bearish reign. Additionally, the MACD’s negative values, along with the weakening volume, suggest the continuation of a bearish trend, though there could be potential for stabilization around the $2.40 support level.
To this end, if the $2.4011 is not able to absorb current bearish pressure, a move into the $1.50 to $1.80 range may materialize.
What’s the Next Target?
XRP on the daily timeframe is still trying to reverse; meanwhile, after the earlier market crash on Friday, the token has seen a sharp decline with an awesome recovery afterwards.
However, it appears that higher prices are being sought after, and as it stands, the larger support still holds around $1.55 and $1.21. To this end, a breakout above $2.69 to $2.79 is needed to confirm the next wave up.
XRP/USDT Analysis: The Bears Are Still in Possession
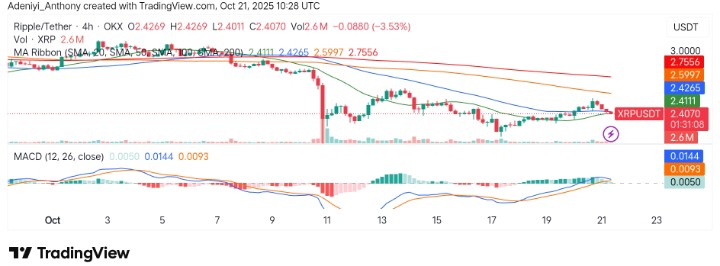
On the 4-hour chat, XRP/USDT, after a drop to $2.40, has bounced slightly, showing signs of a possible short-term recovery. Meanwhile, both the blue and orange lines of the MACD indicate a potential bearish continuation despite positive indication, suggesting that the price may experience a bearish move after a short-term upward move if the buying momentum fails.
Additionally, the price is still below the 200-period moving average, struggling with shorter-term moving averages. Though this suggests a potential short-term bullish reversal. However, the overall downtrend from the daily chart still holds as a dominant force.
To this end, XRP seems to be improving, but more confirmation is needed above $2.6900 to ascertain a bullish stance.
You can purchase crypto coins here. Buy Crypto