Litecoin (LTC/USD) Market Slightly Dumps
Estimated Reading Time: 3 minutes
Don’t invest unless you’re prepared to lose all the money you invest. This is a high-risk investment and you are unlikely to be protected if something goes wrong. Take 2 minutes to learn more
Litecoin Price Prediction – August 26
It observed that the LTC/USD market slightly dumps in valuation as the crypto operations have not been able to break out northwardly against the resistance at $200 for quite a while. The percentage rate of trading is at around -4.01, trading around $170 as of writing today.
LTC/USD Market
Key Levels:
Resistance levels: $200, $240, $280
Support levels: $150, $130, $110
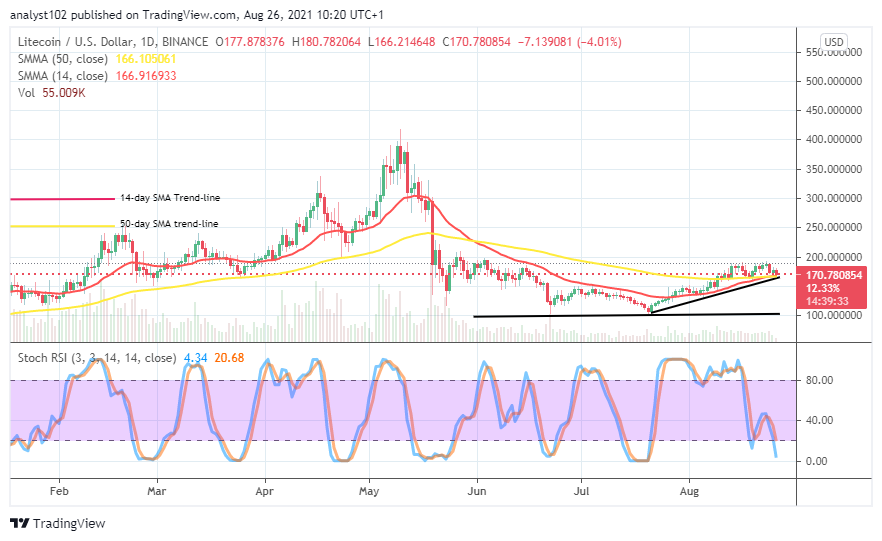
LTC/USD – Daily Chart
The LTC/USD daily chart shows that the crypto market slightly dumps valuation within the values of $200 and $150. And, those values have over a couple of sessions kept. The 14-day SMA trend-line remains touched to the 50-day SMA trend-line from underneath. And, the bullish trend-line drew closer to the trend-line of the smaller SMA in a supportive posture. A tiny bearish candlestick appears a bit over the conjoined area of the SMAs. The Stochastic Oscillators have swiftly crossed the lines into the oversold region close to the last range line. That shows that the downward force may not stand the test of time.
As the LTC/USD market slightly dumps, will there be a further price decline in the trading operations?
The LTC/USD market slightly dumps within the values of $200 and $150 again. Bulls are to be on the lookout for the area that the downward force tends to get weakened. The weak trading zone will be the focus point by long-taking position traders to spot a bullish candlestick that may emerge, using a 1-hour chart for observation with probably the assistance of a 4-hour chart to get a clearer picture of confirmation.
On the downside, the LTC/USD market bears should watch out for a successful-fearful breakdown against the conjoined area of the SMA trend lines and the immediate support level of $150 to prevail further in the following sessions. However, traders exerting further selling orders below the value mentioned earlier needed to be wary of their decisions to avoid the possibility of getting whipsawed afterward.
LTC/BTC Price Analysis
In comparison, the trending capacity of the base crypto still pressurizes by the counter crypto as the market slightly dumps close to its support baseline. The 14-day SMA indicator is underneath the 50-day SMA indicator as the bearish trend-line drew southward between them to place a resistance mark on the buy signal side of the smaller SMA. The Stochastic Oscillators have dipped into the oversold region, with the blue line touching close to the range zero. That indicates that the base crypto may soon regain its momentum pairing with the chief-counter crypto.
Note: Cryptosignals.org is not a financial advisor. Do your research before investing your funds in any financial asset or presented product or event. We are not responsible for your investing results.
You can purchase crypto coins here. Buy Tokens