Lucky Block Price Prediction: LBLOCK/USD May Find Support Around the $0.000090 Mark
Estimated Reading Time: 3 minutes
Don’t invest unless you’re prepared to lose all the money you invest. This is a high-risk investment and you are unlikely to be protected if something goes wrong. Take 2 minutes to learn more
Lucky Block Price Prediction – April 15
The Lucky Block price prediction indicates that LBLOCK is currently trading at approximately $0.000026, with buyers actively working to drive the market upward.
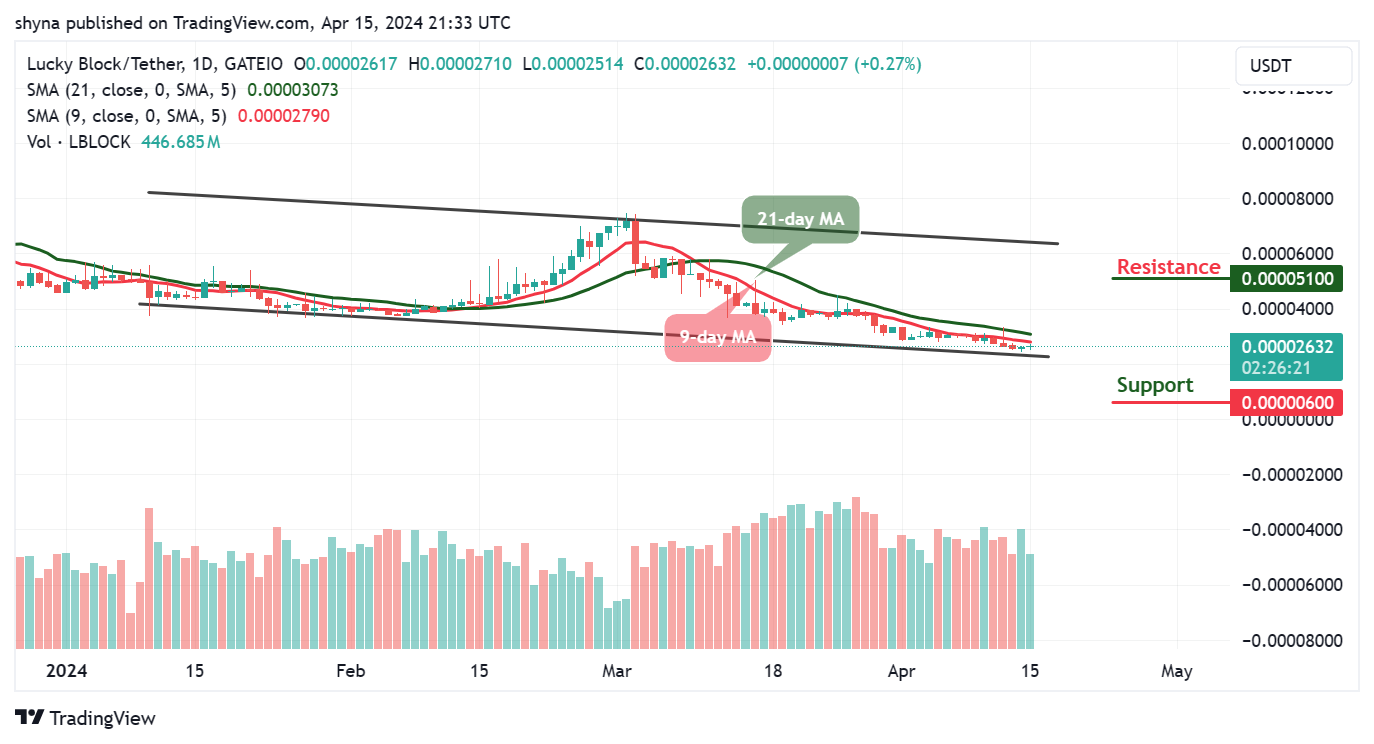
LBLOCK/USD Long-term Trend: Bearish (1D Chart)
Key Levels:
Resistance levels: $0.000051, $0.000053, $0.000055
Support levels: $0.000006, $0.000004, $0.000002
LBLOCK/USD buyers are poised to rally and drive the price beyond the $0.000030 mark. Despite sellers pushing it to its lowest support around $0.000025, Lucky Block swiftly bounced back. Additionally, it seems this cryptocurrency has established robust support, indicating potential upward momentum.
Lucky Block Price Prediction: LBLOCK/USD Gets Ready for the North
The Lucky Block price is poised for a surge in trading volume, signaling a bullish trend ahead. However, a delay in this upward movement could invite increased bearish pressure, potentially deterring new investors. In the event of a downturn, support levels are projected at $0.000006, $0.000004, and $0.000002, respectively.
Nevertheless, a bullish momentum is expected once the 9-day moving average crosses above the 21-day moving average. Any upward movement toward the upper boundary of the channel may encounter resistance at potential levels of $0.000051, $0.000053, and $0.000055.
LBLOCK/USD Medium-term Trend: Bearish (4H Chart)
Based on the 4-hour chart analysis, the Lucky Block price is currently trending above both the 9-day and 21-day moving averages, with the coin stabilizing around $0.000026. This positioning suggests a potential upward trajectory. However, a breach beyond the resistance level of $0.000028 could propel Lucky Block toward the next resistance level at $0.000030 and beyond.
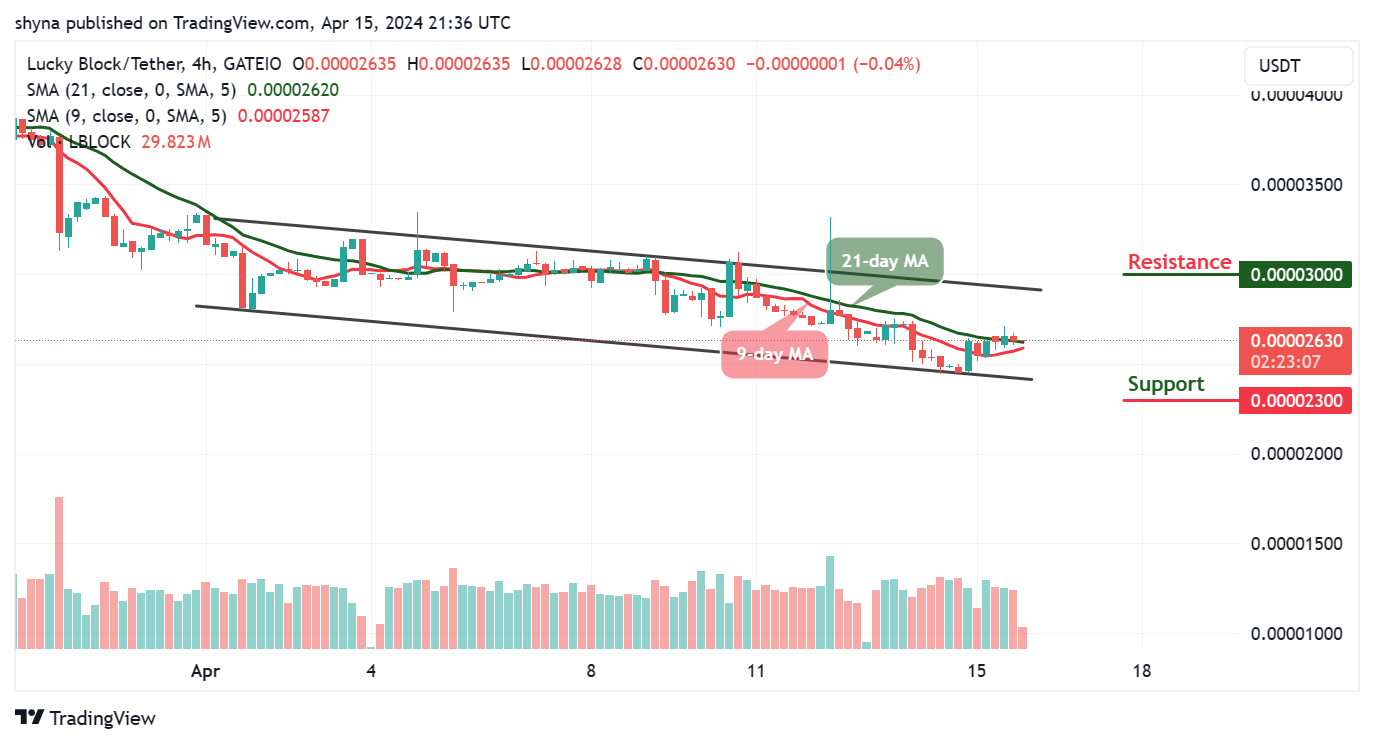
Conversely, the Lucky Block price can dip below the lower boundary of its current channel, potentially reaching the support level at $0.000023 and below. In such a scenario, buyers are anticipated to capitalize on the dips. Moreover, the expected bullish crossover of the 9-day moving average above the 21-day moving average could further prepare Lucky Block for an upward movement.
You can purchase Lucky Block here. Buy LBLOCK