BNB (BNB/USDT) Gearing Up for a Breakout Around $620
Estimated Reading Time: 3 minutes
Don’t invest unless you’re prepared to lose all the money you invest. This is a high-risk investment and you are unlikely to be protected if something goes wrong. Take 2 minutes to learn more
BNB/USDT Long-term Analysis: Ranging
For the past few weeks, the market for BNB against the Tether has been showing signs of consolidation. The pair appears to be showing signs of a big move ahead, but the price has been moving sideways between a specified range. As it stands, the pair’s price appears to have found support around the mid-band of the contracting Bollinger bands with little positive changes, which suggests a big move might be on the way.
However, the volume has remained relatively steady with no spike, suggesting the market is still preparing for a breakout as the Stochastic RSI faces down, awaiting a bullish crossover.
To this end, BNB trades at $623.69, printing over 40 thousand traded volumes with a 1.28% marginal change compared to previous traded volumes.
Technical Indicators
Major Resistance Levels: $643.00, $663.00, and $691.93
Major Support Levels: $621.65, $600.00, and $551.37
BNB Technical Analysis
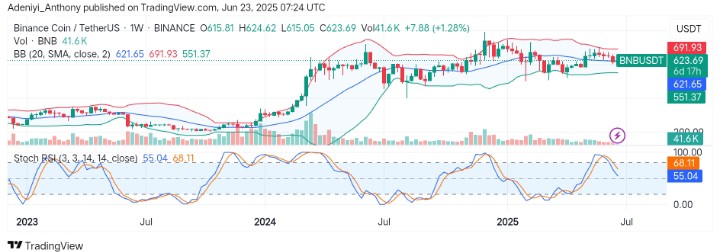
The analysis of BNB against the Tether shows that the pair is forming a volatility squeeze on the weekly chart as the price appears to be resting on the dynamic line of the Bollinger Bands. However, the Stochastic oscillator seems to be recovering from the previous position, though still down. This suggests a bullish continuation for the pair if a breakout above $645 can materialize.
However, from another angle, the volume appears to be mild, but a breakdown from the $600 psychological level with strong bearish participation may invalidate the bullish bias.
BNB/USDT Analysis: Where from Here?
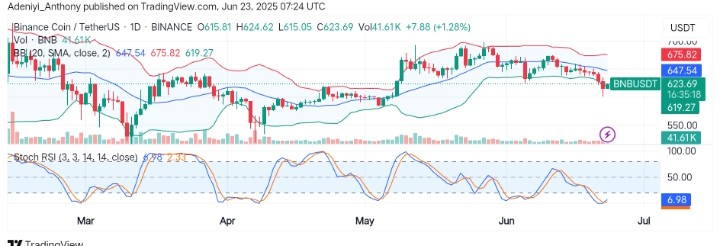
On the daily chart, BNB/USDT is bouncing off the lower Bollinger band, showing a short-term buying interest as the price hangs above the $619 level. However, the momentum oscillator, on the other hand, appears to be rising from an oversold region, signaling a possible short-term upward push is ongoing.
To this end, the volume remains steady as the pair’s value increases, indicating the trend may reverse upward if momentum builds above the $645 resistance level.
You can purchase crypto coins here. Buy LBlock