BNB (BNB/USDT) Bullish Traders Eye New Highs Amid Market Indecision
Estimated Reading Time: 3 minutes
Don’t invest unless you’re prepared to lose all the money you invest. This is a high-risk investment and you are unlikely to be protected if something goes wrong. Take 2 minutes to learn more
BNB Long-term Analysis: Ranging
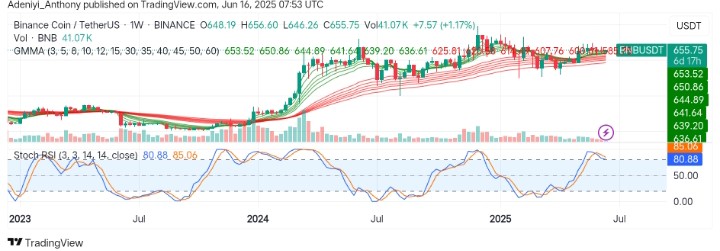
The market BNB against the Tether is currently exhibiting a sideways consolidation within a well-defined range after its major rally in early 2024. However, despite the flattening Guppy Multiple Moving Averages (GMMAs) ribbons, bullish interest remains. This was supported by higher lows and a bounce off key GMMA support bands.
As it stands, the volume remains stable, with bulls slowly regaining control. The Stochastic RSI is bent towards 80.00 and appears to be curling up for another short-term upside movement, indicating a potential continuation to the upside.
Currently, BNB trades at $655.75, recording over 41 thousand traded volumes at the beginning of the week.
Technical Indicators
Major Resistance Levels: $670.00, $700.00, and $750.00
Major Support Levels: $641.64, $636.61, and $625.81
BNB Technical Analysis
The analysis of BNB against the Tether on a weekly chart shows that the pair’s value has respected dynamic GMMAs support for over three weeks, with bullish wicks confirming buying interest. However, the GMMA shows compression between long-term and short-term EMAs, signaling the bulls may be driving the price up as the bullish structure remains despite long-period consolidation.
On the other hand, the Stochastic RSI at 80.88 and 85.06 pictures a bullish crossover in overbought territory, suggesting an upcoming strong momentum.
So far, the volume of bullish candles has been increasing—an early signal of breakout preparation. However, a confirmation above $660.00 with closing strength may lead to a test of $670.00 and beyond.
BNB/USDT Analysis: What to Expect
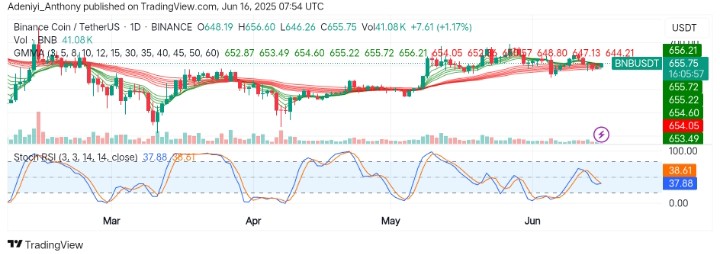
On the daily chart, BNB/USDT appears to maintain a tight sideways consolidation just above the GMMA support. However, the price recently tested and rebounded off the lower dynamic GMMA band, confirming buyer presence.
On the other hand, the volume remains modest, yet there’s a steady build-up near resistance zones around $655.72–$656.21 as the short-term EMAs and the Stochastic oscillator indicate an imminent signal of a movement to the north.
To this end, if confirmed, daily momentum may ignite a broader continuation above the $660.00 resistance; otherwise, the pair risks sideways movement continuation or a downtrend.
You can purchase crypto coins here. Buy LBlock