Solana (SOL/USD) Price Faces a Retracement, Attempting a Base
Estimated Reading Time: 3 minutes
Don’t invest unless you’re prepared to lose all the money you invest. This is a high-risk investment and you are unlikely to be protected if something goes wrong. Take 2 minutes to learn more
Solana Price Prediction – October 13
Exchanging market dealings between buyer and seller in the business activities of SOL/USD has been seen as the crypto-economic trade faces a retracement movement process, attempting a base.
The latest high and low prices are approximately $21.47 and $21.12 points, and the bargaining line had been concentrated around a sensible trade area of $21 for a few hours prior. From the current trading point of $21.37, holding a minute percentage rate of 0.38 as of the technical analysis write-up, it might be risky to go for an early longing back of positions. Trading professionals should adhere to optimum active price action to support their entry.
SOL/USD Market
Key Levels:.
Resistance levels:$23, $25, $27
Support levels: $20, $19, $18
SOL/USD – Daily Chart
The SOL/USD daily chart reveals that the crypto market faces a retracement, attempting a base near the support line of $20.
As there has been a slight input of a bullish-trading moment on the current trading candlestick around the middle Bollinger Band, that shows that bears may have had their ways tending to end soon. The Bollinger Bands are seen at $24.95, $21.70, and $18.46. The stochastic oscillators have crossed southbound, placing them from 48.98 to 2.07. Based on those values, the furtherance of lows does not have a smooth run downward afterward.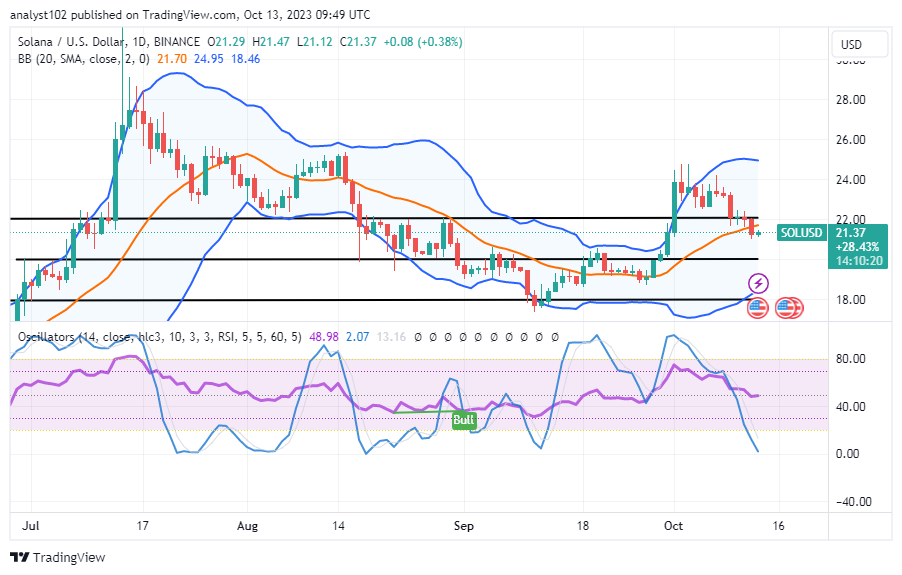
What metrics indicate that the SOL/USD market is debasing?
The middle horizontal line drawn at the $20 support line will serve as the critical spot, given that the SOL/USD price faces a retracement, attempting a base above the value line.
A start to the stance-regaining process has been obtained, with the power of buying coming stronger between $22 and $20 values. It would be a good idea for long-position pushers to be on alert to be able to make points alongside any active motions aiming to back up the motions to the upside.
Sellers will run the danger of breaking through the middle Bollinger Band’s underlying support levels more frequently on the negative path. Aggression won’t emerge to support the motions to the south side due to the market’s current placement segment, which is around the point of $22.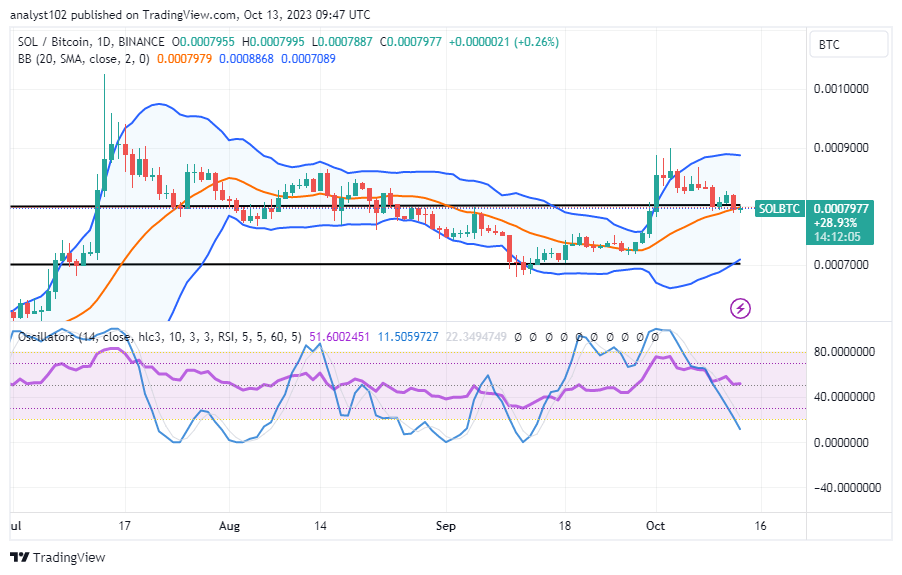
SOL/BTC Price Analysis
In contrast, Solana faces a retracement moving trend against the purchasing weight of Bitcoin, attempting a base.
The line of candlesticks has been formed to reach the middle Bollinger Band trend line. The upper Bollinger Band has been positioned to shield resistances above the current trade line. In order to protect resistances above the current trade line, the upper Bollinger Band has taken position. The oversold area has been entered by the blue stochastic oscillator, increasing the likelihood that the base cryptocurrency will go upward in the near future.
Note: Cryptosignals.org is not a financial advisor. Do your research before investing your funds in any financial asset or presented product or event. We are not responsible for your investing results.
You can purchase Lucky Block here. Buy LBLOCK