UMA (UMAUSD) Falls After Bulls Suffer Rejection at $9.900
Estimated Reading Time: 2 minutes
Don’t invest unless you’re prepared to lose all the money you invest. This is a high-risk investment and you are unlikely to be protected if something goes wrong. Take 2 minutes to learn more
Price Analysis – $9.900 Proves Too Strong for UMA, Price Falls
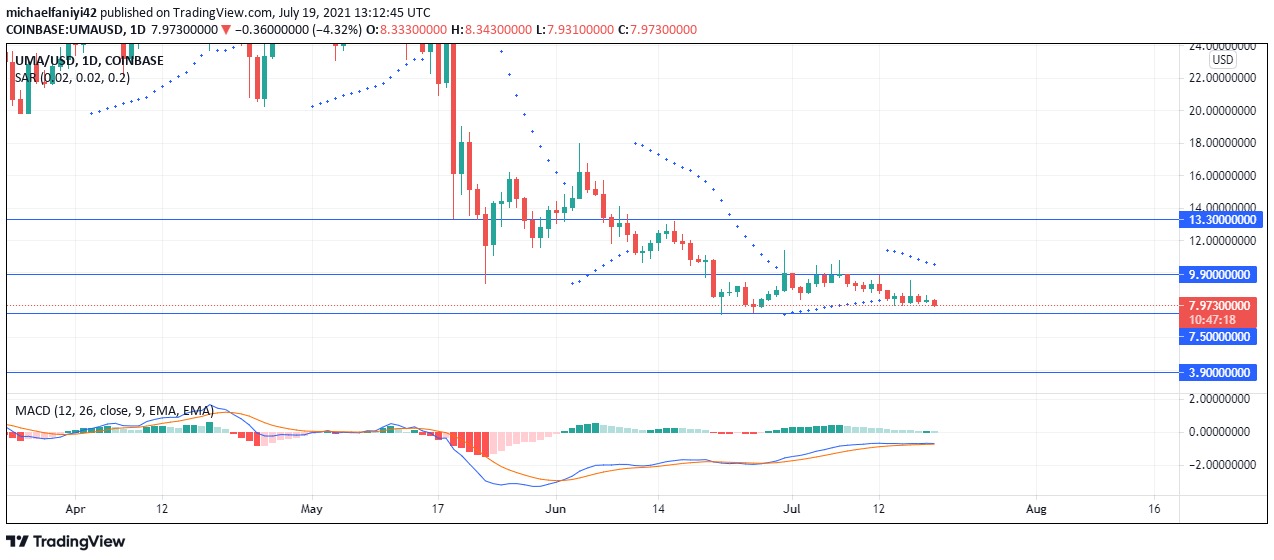
UMA falls after rejection from the $9.900 resistance. This comes after the price has bounced off the $7.500 demand level for the second time. The first time was on the 22nd of June 2021, when the price immediately dropped even before it got to the $9.900 supply level. At this second attempt, the bulls persisted in trying to break out. This can be seen in the rise of the candles’ wick above the key level several times.
UMA Significant Zones
Supply Zones: $13.300, $9.900, $
Demand Zones: $7.500, $3.900, $
On the 8th of July 2021, the bulls got tired and the price ceased trying to break out of the $9.900 resistance. UMA then displays a series of miniature candles. This shows the reluctance of the buyers to hold off. On the 16th of July 2021, bulls attempted to rally again, thereby forming an inverted hammer candle. But yet again, the bears prevailed to keep dragging the market down.
The Parabolic SAR (Stop and Reverse) has aligned 7 dots above the daily candles. This signifies that the market is carrying out a definite bearish activity. The MACD (Moving Average Convergence Divergence) also echoes the same sentiment as it presents reducing bullish histogram bars. Its signal lines have also remained below the zero level since the 14th of May 2021.
Market Anticipation
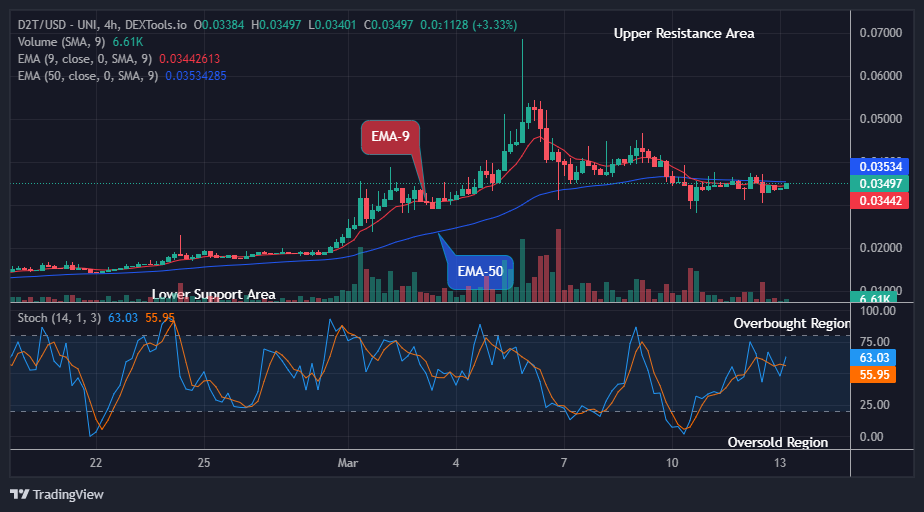
On the 4-hour chart, the candlesticks climbed above the $9.900 resistance for 11 trading days before falling below it again. The coin has been in a downtrend ever since. There was a spike twice as the market fell. They occurred on the 12th and the 16th of July 2021.
The Parabolic SAR confirms bullish movement as well as the MACD indicator, which shows dwindling histogram bars. Bears will eventually drive the coin down to $7.500, from which it is expected that bulls will take over to push the price back to $9.900 to attempt another breakout.
You can purchase crypto coins here: Buy Tokens
Note: Cryptosignal.org is not a financial advisor. Do your research before investing your funds in any financial asset or presented product or event. We are not responsible for your investing results.