Ethereum (ETH/USD) Price May Push Down into Corrections
Estimated Reading Time: 3 minutes
Don’t invest unless you’re prepared to lose all the money you invest. This is a high-risk investment and you are unlikely to be protected if something goes wrong. Take 2 minutes to learn more

Free Crypto Signals Channel
Ethereum Price Prediction – July 17
There have been indications piling up to suggest the ETH/USD price may push down into corrections below the $1,500 resistance line any time from now. Over several hours ago, the crypto’s economic valuation has been trading between $1,385 and $1,319 at a minimal percentage rate of 0.60 negative.
ETH/USD Market
Key Levels:
Resistance levels: $1,500, $1,750, $2,000
Support levels: $1,000, $800, $600
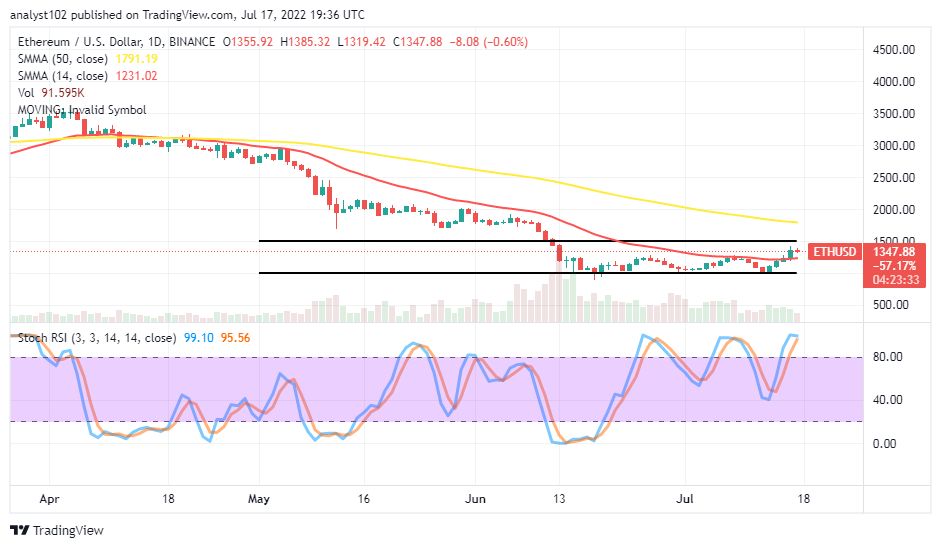
ETH/USD – Daily Chart
The ETH/USD daily chart showcases the crypto-economic price may push down into corrections below the $1,500 resistance level. Two horizontal lines are to show the market trades within definite range-bound zones. The lower range value is at the $1,000 support level, while the upper is at the value line mentioned earlier. The 14-day SMA indicator is in the range zones underneath the 50-day SMA indicator. The lower range value is at the $1,000 support level, while the upper is at the value line mentioned earlier. The 14-day SMA indicator is in the range zones underneath the 50-day SMA indicator.
Can there still be more ups in ETH/USD market as the price pushes close to the $1,500 resistance?
The Reading position of the Stochastic Oscillators has it the ETH/USD price may push down into corrections below the $1,500 resistance level. Therefore, it would be a dicey trading condition to expect more ups in the market in the near time as that price is trading within range-bound zones. Long-position takers need to suspend longing for orders for a while as at the moment.
On the downside of the technical analysis, it currently appears the ETH/USD market short-position takers will soon have a smooth stance to push against the uprising motion of the crypto economy toward the resistance at $1,500. A bearish candlestick will have to occur for confirmation closely beneath the value line before a decent-shorting order can be afterward. The 50-day SMA reveals a tougher-resistance-trading point at $1,791 against any long-term pushes that can emanate over the upper range line afterward.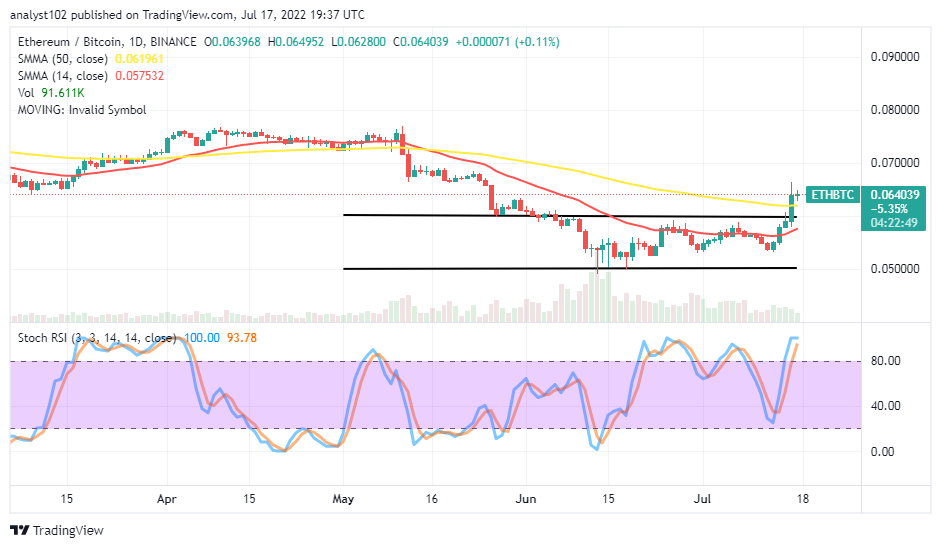
ETH/BTC Price Analysis
Ethereum has demonstrated holding positions firmly further against the trending force of Bitcoin. The cryptocurrency pair price may push down into corrections as it has broken out at the upper range line, getting the trend line of the bigger SMA involved. The 14-day SMA indicator is bending northward in the range-bound zones underneath the 50-day SMA indicator. The Stochastic Oscillators are in the overbought region, relatively attempting to close the lines within. It currently depicts the base crypto is on the verge of exhausting its trending force against the countering crypto. A formation of a bearish candlestick at any point over the SMAs will be a signal to getting a resumption of the downward trend.
Note: Cryptosignals.org is not a financial advisor. Do your research before investing your funds in any financial asset or presented product or event. We are not responsible for your investing results.
“Lucky is up more than 50% today but still more than 430% from All Time Highs!
The opportunity to bank BIG is now!
You can purchase Lucky Block here. Buy LBlock