Bitcoin (BTC/USD) Price Exhausts, Tending to Retrace
Estimated Reading Time: 4 minutes
Don’t invest unless you’re prepared to lose all the money you invest. This is a high-risk investment and you are unlikely to be protected if something goes wrong. Take 2 minutes to learn more
Bitcoin Price Prediction – October 18
Today’s trading operations between buyer and seller in the Bitcoin market versus the US coin have pushed to the north before currently showcasing that the crypto-economic trade exhausts its energy around the point of $30,000, tending to retrace below the line soon.
The level of $29,000, according to logical trade thinking, would serve as the key determining line for either increase to form extensively or to revert to a full-fledged correctional motion in the next operations. For a while, a falling force will inevitably find its way between $30,000 and $29,000. If the price shifts downward once again to restore its power from the lower points of $26,000 and $27,000, it would be a common transaction line phenomenon. Pushing along those spots should be avoided by short-position placers.
BTC/USD Market
Key Levels:
Resistance levels: $29,500, $30,500, $31,500
Support levels: $26,500, $25,500, $24,500
BTC/USD – Daily Chart
The BTC/USD daily chart showcases that the crypto-economic price exhausts energy after touching a higher trading point of $30,000, tending to retrace from the other side of the buying area of the upper Bollinger Band trend line.
By remaining at $28664.47, $27,554.34, and $26,444.21, the Bollinger Band trend lines are gradually being shifted toward the north side. The stochastic oscillators are in the overbought zone and are holding positions between 63.18 and 93.96. The candlesticks’ succeeding surfacing pattern will generally yield to rejection indexes’ warnings against only receiving unfettered rising thrusts.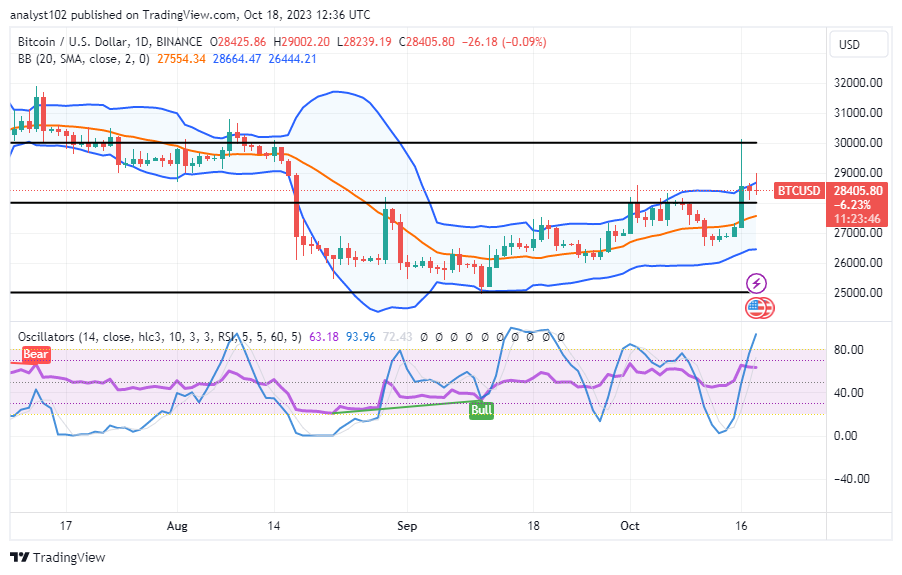
Should buyers in the BTC/USD market keep pushing for further gains given the prognosis for this trading formation?
As it has been demonstrated that long-position takers have been gradually finding their baseline basically around the path of the middle Bollinger Band trend line, investors should never intend to sell their positions at reduction spots, given that the BTC/USD market exhausts energy around the point of $30,000, tending to retrace sequence to that event about three days ago.
As the current trading environment stands, sellers should position themselves to look for active reversal actions as prices try to climb up near the upper Bollinger Band trend line. Trade actions above the $30,000 resistance line will cause bulls to pause for a bit.
Long-position placers should be cautious when passing through the overhead resistances at the point of $29,500 because the market is currently trading around that level at a minute negative percentage rate of 0.09. For the time being, buyers are instructed to launch their comebacks by positioning themselves between the middle and lower Bollinger Band trend lines.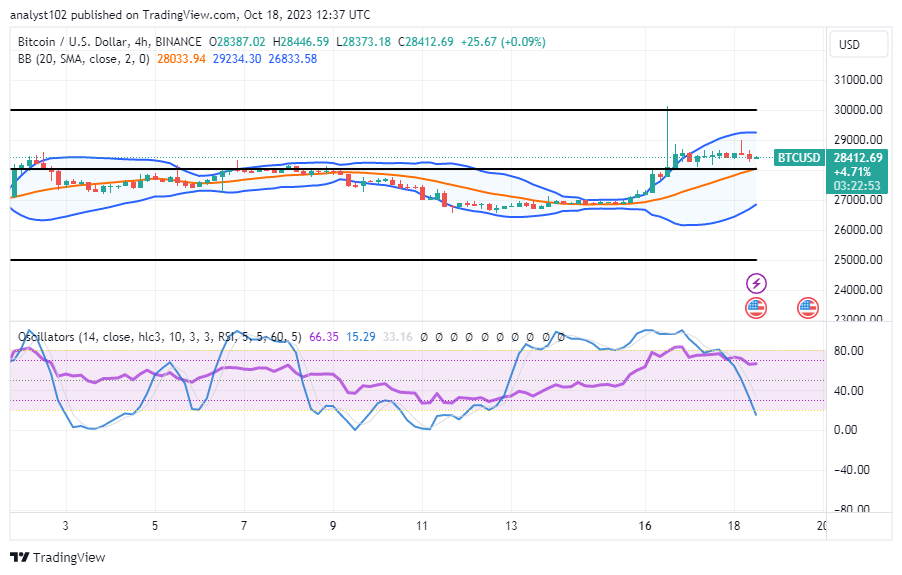
BTC/USD 4-hour Chart
The BTC/USD 4-hour chart showcases that the crypto-economic price exhausts energy around the spot of $30,000, tending to retrace beneath the upper Bollinger Band trend line.
The trend lines for the Bollinger Band are set at $29,234.30, $28,033.94, and $26,833.58. The stochastic oscillators have moved from 66.35 to 15.29 points in the southward direction. As of the writing of this article, a line of candlesticks in the formation setting indicates that lower lows will persist for some time.
Note: Cryptosignals.org is not a financial advisor. Do your research before investing your funds in any financial asset or presented product or event. We are not responsible for your investing results.
You can purchase Lucky Block here. Buy LBLOCK