Ethereum Faces Rejection at $1,400 as Bears Threaten to Short
Estimated Reading Time: 2 minutes
Don’t invest unless you’re prepared to lose all the money you invest. This is a high-risk investment and you are unlikely to be protected if something goes wrong. Take 2 minutes to learn more

Free Crypto Signals Channel
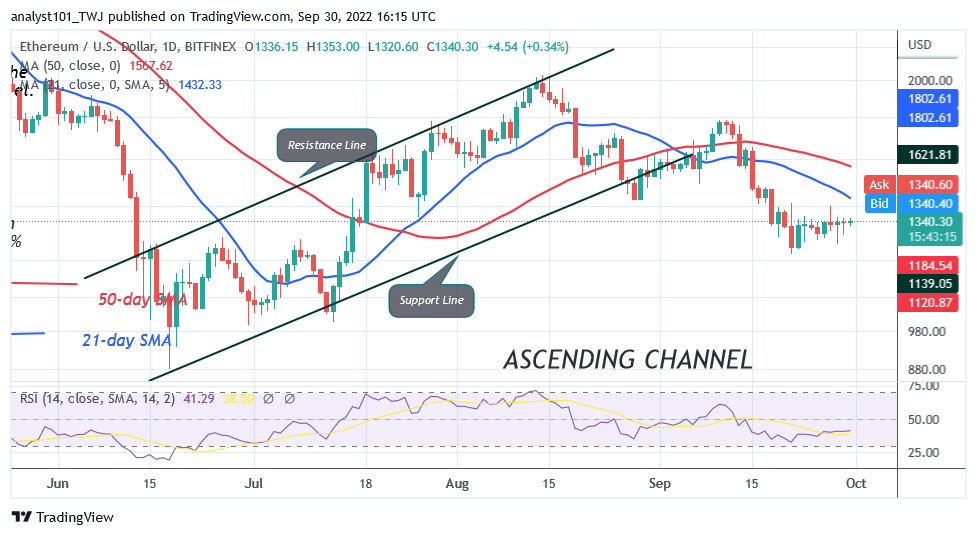
Ethereum Price Long-Term Analysis: Bullish
Ethereum’s (ETH) price is in a sideways move as bears threaten to short. The altcoin is trading above the $1,220 support as it resumes a sideways move. Since September 21, the biggest altcoin has been fluctuating between $1,220 and $1,400 price levels. On the upside, the upward move has been restrained by the 21-day line SMA or the $1,400 high. The selling pressure will resume if price breaks below the current support. Ether will further decline to the low of $1,162 or $1,029 price level.
Ethereum Indicator Analysis
The biggest altcoin is at level 42 of the Relative Strength Index for period 14. The RSI has been stable because of the sideways move. Ether risks further decline as price bars are below the moving average lines. The altcoin is in a bullish momentum as Ether is above the 25% range of the daily stochastic. The moving average lines are slopping southward indicating the downtrend.
Technical indicators:
Major Resistance Levels – $2, 600, $2,800, $3,000
Major Support Levels – $1.500, $1, 300, $1,100
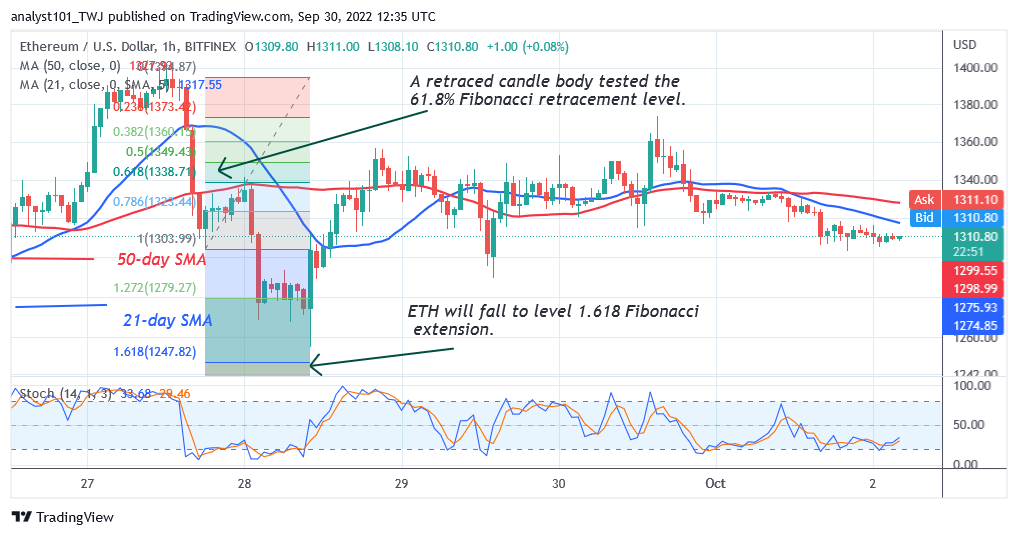
What Is the Next Direction for Ethereum?
On the 1-Hour chart, the biggest altcoin has resumed selling pressure as bears threaten to short. On the September 27 price slump, a retraced candle body tested the 61.8% Fibonacci retracement level. The retracement suggests ETH will fall to level 1.618 Fibonacci extension or $1,247. 82.
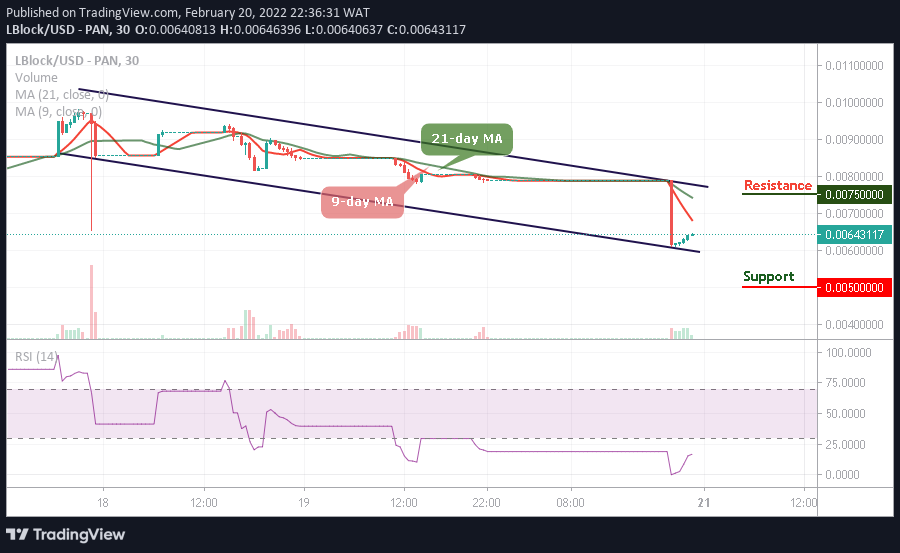
You can crypto coins here. Buy LBLOCK
Note: Cryptosignals.org is not a financial advisor. Do your research before investing your funds in any financial asset or presented product or event. We are not responsible for your investing results