Bitcoin (BTC/USD) Market Surges Upward Before Retracing
Estimated Reading Time: 3 minutes
Don’t invest unless you’re prepared to lose all the money you invest. This is a high-risk investment and you are unlikely to be protected if something goes wrong. Take 2 minutes to learn more
Bitcoin Price Prediction – December 15
It is that the BTC/USD market operation surges upward before retracing after a chain of recessions around the $17,000 trading spot. Buying and selling of the crypto trade between $17,855.30 and $17,563.34 value lines at a minute negative percentage rate of 0.76.
BTC/USD Market
Key Levels:
Resistance levels: $18,500, $19,500, $20,500
Support levels: $16,500, $15,500, $14,500
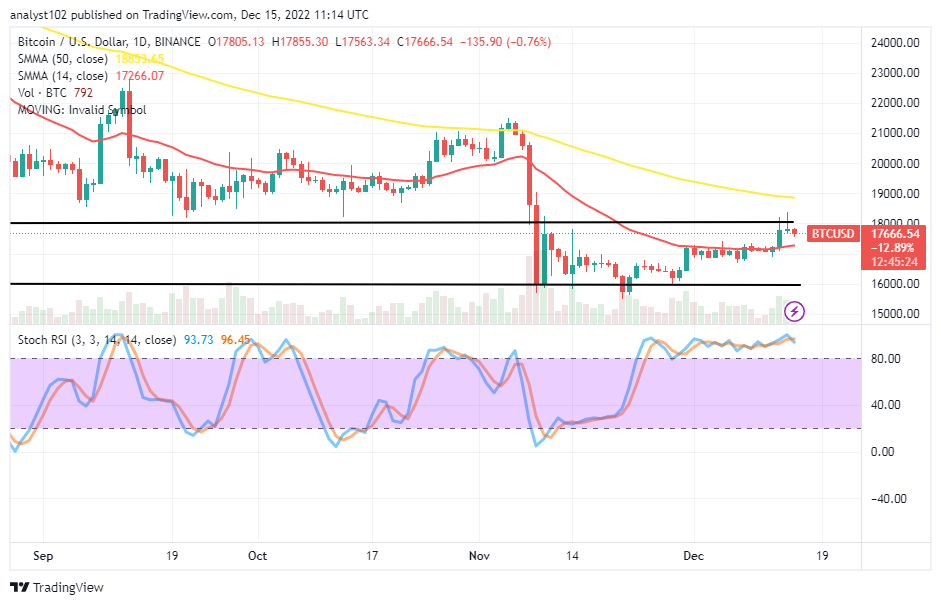
BTC/USD – Daily Chart
The daily chart showcases that the BTC/USD market activity has earlier surged upward before retracing predominantly around the $18,000 resistance level in the latest sessions. The upper and the lower horizontal lines drew at $18,000 and $16,000 points to indicate the yet-to0be-left trading range-bound zones of the crypto’s price. The 14-day SMA indicator is at $17,266.07 below the $18,853.65 point of the 50-day SMA indicator. The stochastic oscillators are trying to cross their lines southward at 96.45 and 9373 levels, indicating the probability of other lows shortly. They are in the overbought region.
Can BTC/USD market fall below $18,000 and lose the most ground?
As of the time of writing, it is likely the BTC/USD market buyers lose some stances more underneath the $18,000 trading level if the reading of the Stochastic Oscillators is anything to go by as the trade surges upward before retracing around the value line in question. In light of that assumption, tending to materialize, long-position placers will have to suspend their trading actions for a while until a fresh lower-trading posture is signaled by the tools used to determine the trending weight of the instruments.
On the negative side of the BTC/USD market’s technical analysis, the upper horizontal line drawn at the $18,000 resistance level shows a barrier to the emergence of ups in the subsequent activities. From a technical point of view, bears have a higher probability of dominating most directions. However, in the process of bulls consolidating around the overbought region, a bullish candlestick may occur to let buyers achieve a higher profit rate against the formal high point.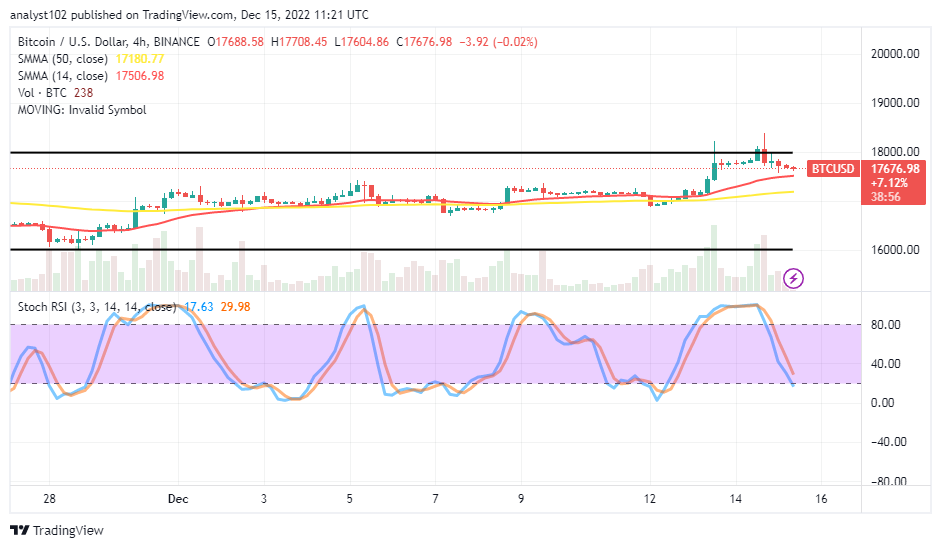
BTC/USD 4-hour Chart
The BTC/USD medium-term chart showcases the crypto market surging upward before retracing toward the trend line of the smaller SMA. The 50-day SMA indicator is at $17,180.77, below the $17,506.98 value line of the 50-day SMA indicator. The Stochastic Oscillators have moved southbound to 29.98 and 17.63 levels because they have outlived their usefulness in the overbought area. Indicating that a downward force is there, they are still pointing downward.
Note: Cryptosignals.org is not a financial advisor. Do your research before investing your funds in any financial asset or presented product or event. We are not responsible for your investing results.
You can purchase Lucky Block here. Buy LBLOCK