Orchid (OXT/USD) Faces Difficulty Overcoming Initial Resistance at $0.07
Estimated Reading Time: 3 minutes
Don’t invest unless you’re prepared to lose all the money you invest. This is a high-risk investment and you are unlikely to be protected if something goes wrong. Take 2 minutes to learn more
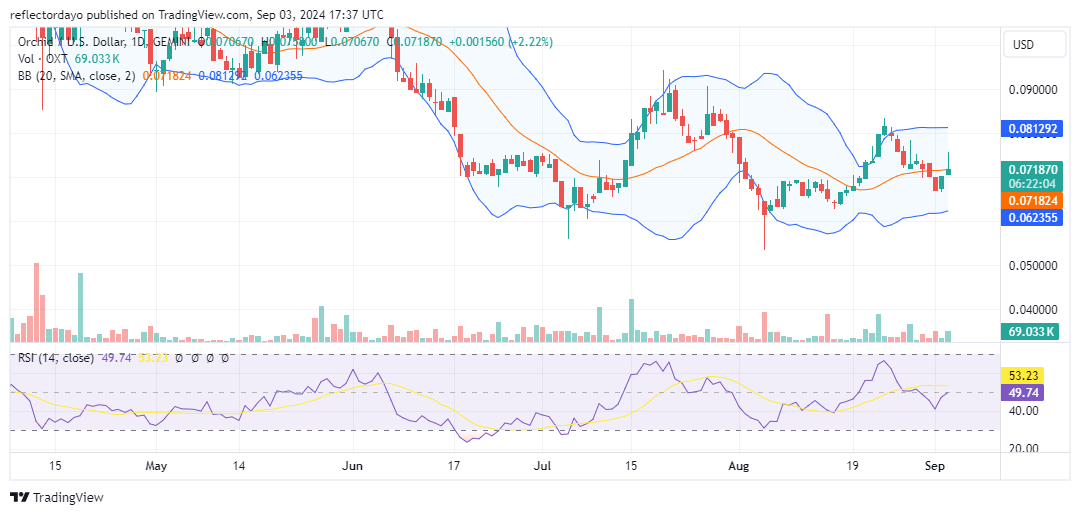
Since reaching a yearly high of $0.18 in early March, the market has been dominated by bearish sentiment. Repeated attempts by bullish Orchid traders to rally the price have resulted in lower lows and lower highs, indicating a clear downward trend.
However, the bearish momentum began to weaken in June, and by July, the market had found support at $0.06. Bulls successfully defended this level, demonstrating growing strength. This resilience has been evident in the formation of higher lows, suggesting a potential reversal in the downtrend.
A significant milestone was achieved today as bulls managed to break through the immediate resistance at $0.07, signaling a potential shift in market sentiment.
Orchid Market Data
- OXT/USD Price Now: $0.072
- OXT/USD Market Cap: $71 million
- OXT/USD Circulating Supply: 979 million OXT
- OXT/USD Total Supply: 1 billion OXT
- OXT/USD CoinMarketCap Ranking: #404
Key Levels
- Resistance: $0.075, $0.080, and $0.085
- Support: $0.070, $0.065 and $0.06.
The Orchid Market Through the Lens of Indicators
Following the significant breakthrough of the $0.07 resistance level, the Orchid token has faced increasing bearish pressure. While bullish traders are currently maintaining the price above $0.07, the market remains vulnerable to a potential decline.
Today’s candlestick pattern, a shooting star, is a bearish crypto signal. This pattern features a small bullish body and a long upper shadow, suggesting a potential reversal.
If the market does indeed enter a bearish trend, breaking below $0.07 would be a significant setback. However, a continued consolidation above this level could indicate that the bullish momentum is still intact.
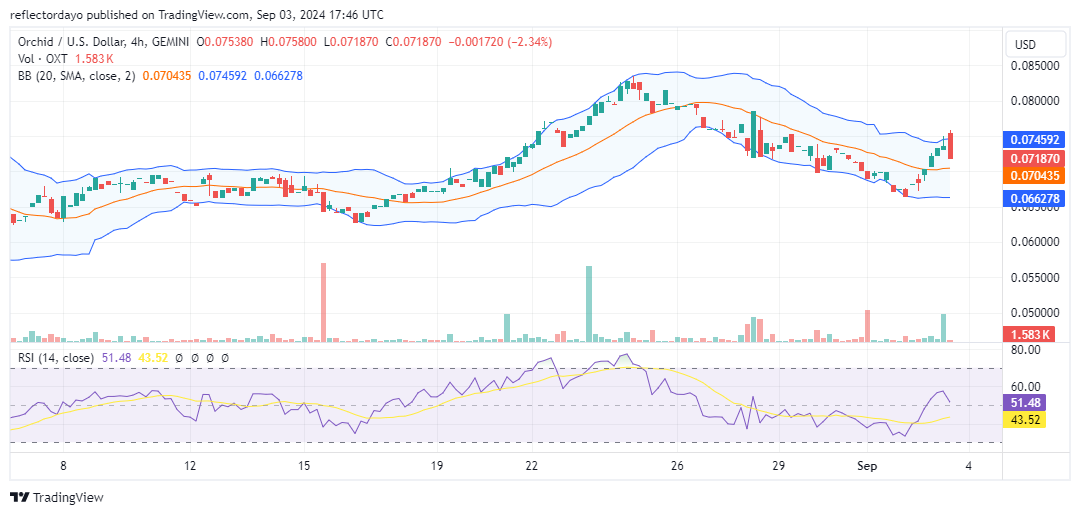
OXT/USD Price Prediction: 4-Hour Chart Analysis
Despite recent bullish momentum, the market has encountered significant resistance at the $0.075 price level. On the 4-hour timeframe, a strong bearish candlestick has emerged, suggesting a potential reversal.
However, the low trading volume associated with this bearish candle casts doubt on its significance. If the market does indeed decline and reaches $0.07, there is a possibility of a bounce as traders may find value at this price level.