Litecoin (LTC/USD) Market Holds Around $50
Don’t invest unless you’re prepared to lose all the money you invest. This is a high-risk investment and you are unlikely to be protected if something goes wrong. Take 2 minutes to learn more

Free Crypto Signals Channel
Litecoin Price Prediction – July 5
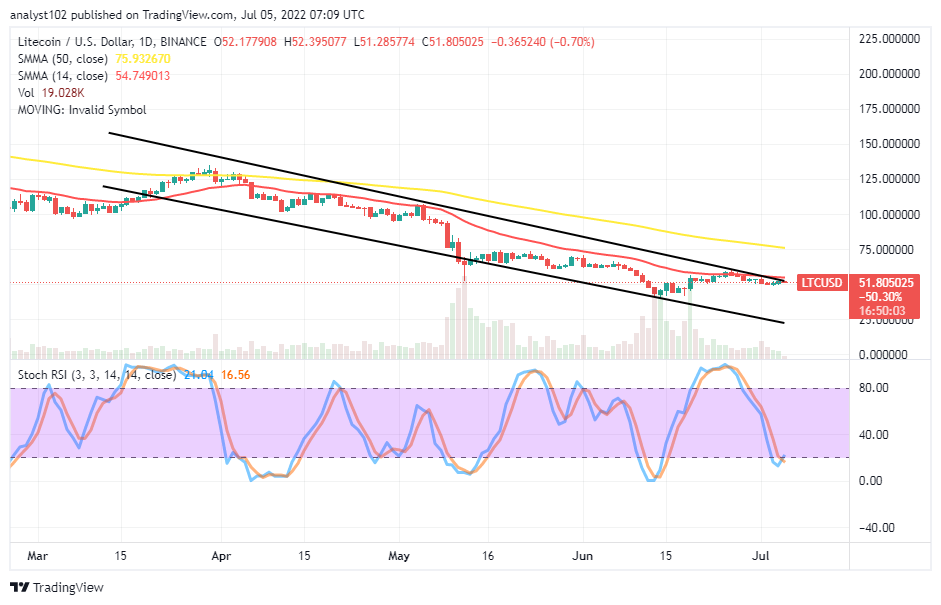
The Litecoin market trading activity currently holds around the $50 line, showing less-active motions in the up and down directions. Price is a bit trading above the value line at a minimal negative percentage rate of 0.70 at a $51 level.
LTC/USD Market
Key Levels:
Resistance levels: $60, $70, $80
Support levels: $45, $40, $35
LTC/USD – Daily Chart
The LTC/USD daily chart reveals the crypto market holds around the $50 trading level in the surrounding of the smaller SMA’s trend line. The 14-day SMA indicator is underneath the 50-day SMA indicator. And they are both bent southward over the current trading spot to affirm the crypto economy is under depression. The Stochastic Oscillators have briefly dipped down past the range of 20 into the oversold region as they now attempt to cross the lines at the same range.
At this point, which direction of the LTC/USD trade tends to gain more force afterward?
Going by the reading of the indicators at the moment, it is dicey to speculate a definite direction that the LTC/USD trade will maintain in the near time as the crypto market holds around $50. However, the positioning of the Stochastic Oscillators suggests the forces to the downside are on the verge of getting a reduction that can prepare the grand for a swing high to occur soon. A reversal of an active move from a lower-trading zone will signal to buy moments in the long run.
On the downside of the technical analysis, the LTC/USD market sellers needed to hold firmly around the trend line of the 14-day SMA. A forceful hike against the trading indicator may cause traders to look for an area where rejections can be before contemplating exerting a sell order. That assumption may come past a high resistant-trading spot of around $75 or a bit above afterward. In the technical sense, sell orders needed to suspend at this point for a while.
LTC/BTC Price Analysis
In comparison, since Litecoin struggled to push northward to gain some lost momentum against the trending ability of Bitcoin, the cryptocurrency pair market now holds around closely above the indicators. The 14-day SMA indicator has moved upward to get conjoined with the 50-day SMA indicator from beneath. The Stochastic Oscillators are in the oversold region, tightly positioned at the range of zero. There has been a featuring of smaller bearish candlesticks to showcase a relatively ongoing correction in the pairing trading cryptos.
Note: Cryptosignals.org is not a financial advisor. Do your research before investing your funds in any financial asset or presented product or event. We are not responsible for your investing results.
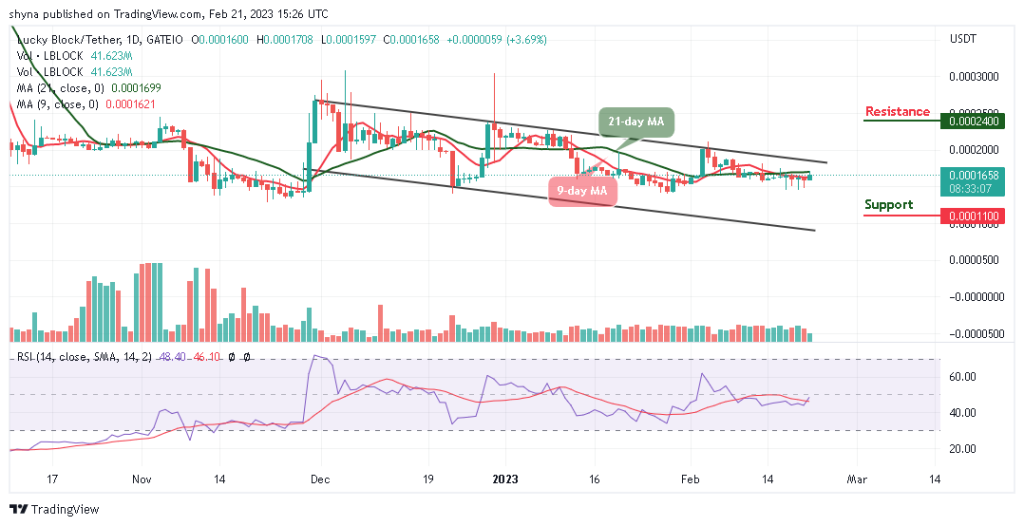
“Lucky is up more than 50% today but still more than 430% from All Time Highs!
The opportunity to bank BIG is now!
You can purchase Lucky Block here. Buy LBlock