Bitcoin Cash (BCH/USD) Market Attempts Downsizing Closely Below $400
Estimated Reading Time: 3 minutes
Don’t invest unless you’re prepared to lose all the money you invest. This is a high-risk investment and you are unlikely to be protected if something goes wrong. Take 2 minutes to learn more

Free Crypto Signals Channel
Bitcoin Cash Price Prediction – April 1
There has been a chain of range-bound moving nature in the BCH/USD trade activities over time after experiencing a rallying motion. Currently, it appears that the crypto-economic market attempts downsizing closely below $400. The points between $389 and $363 have been the spot where price is trading as of writing at a negative percentage of 3.29.
BCH/USD Market
Key Levels:
Resistance levels: $400, $450, $500
Support levels: $300, $250, $200
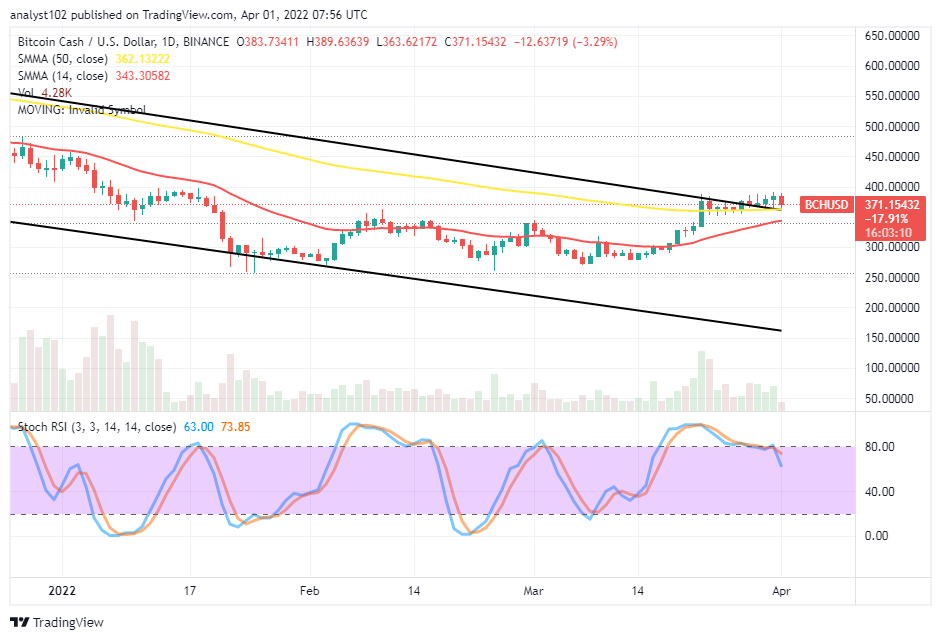
BCH/USD – Daily Chart
The BCH/USD daily chart showcases the crypto-economic market attempts downsizing closely below $400. The 14-day SMA indicator is underneath the 50-day SMA indicator. The upper bearish trend line is drawn around the bigger SMA as a line of variant candlesticks featured to denote a ranging pattern outlook. The Stochastic Oscillators have crossed their lines southbound from the range of 80 after featuring a line of consolidation moving manner in the overbought region.
Will the BCH/USD price range for long in the $400 and $350 spots as the crypto market attempts downsizing closely below $400?
The BCH/USD price may not hold long for in the range-bound spots of $400 and $350 levels as the crypto-economic market attempts downsizing closely below the higher value-line. A bearish candlestick that can emerge against the bigger SMA, will affirm the possibility of getting sustainable downing moves in the subsequent trading sessions. As a result of that, long-position takers needed to suspend taking more buying positions.
On the downside of the technical analysis, the BCH/USD short-position takers needed to their stances hold firm below the $400 resistance level. The outlook to get a decent sell order has been setting to observe in the crypto economy. The range-line points mentioned will be instrumental in the determination of the subsequent trading operation direction.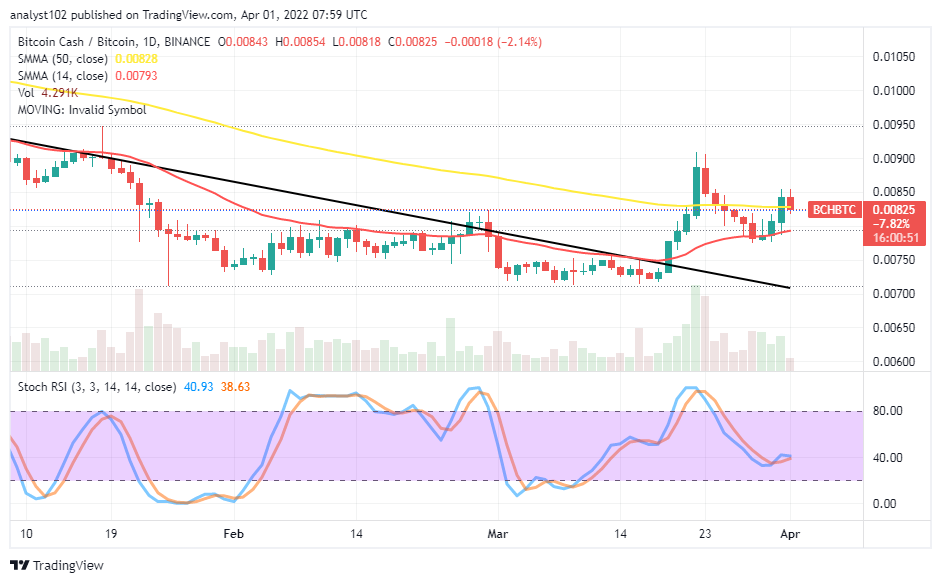
BCH/BTC Price Analysis
In comparison, Bitcoin Cash has relatively resumed a downing process against Bitcoin. The cryptocurrency pair market attempts downsizing around the bigger SMA trend line. The 14-day SMA indicator is underneath the 50-day SMA indicator. The bearish trend line drew southwardly at the end beneath the SMAs. The Stochastic Oscillators are down around the range of 40, attempting to resume a consolidation moving process. It is likely the base crypto will lose some points to the flagship countering crypto in nearest possible time.
Note: Cryptosignals.org is not a financial advisor. Do your research before investing your funds in any financial asset or presented product or event. We are not responsible for your investing results.
You can purchase Lucky Block here. Buy LBlock: