Cartesi (CTSI/USD) Bursts Higher With Bullish Momentum
Estimated Reading Time: 3 minutes
Don’t invest unless you’re prepared to lose all the money you invest. This is a high-risk investment and you are unlikely to be protected if something goes wrong. Take 2 minutes to learn more

Cartesi (CTSI) is showing a strong bullish undercurrent in today’s trading session, with buyers driving the market sharply upward. The session opened near the $0.073 level, and momentum quickly carried the price to test above the previous high at $0.12. However, that surge proved unsustainable, as profit-taking set in, triggering a correction that pulled the price back toward the $0.10 level.
Cartesi (CTSI/USD) Market Data
- CTSI/USD Price Now: $0.1008
- CTSI/USD Market Cap: $84 million
- CTSI/USD Circulating Supply: 878.8 million CTSI
- CTSI/USD Total Supply: 1 billion CTSI
- CTSI/USD CoinMarketCap Ranking: #409
Key Levels
- Resistance: $0.11, $0.12, and $0.13
- Support: $0.80, $0.70, and $0.60
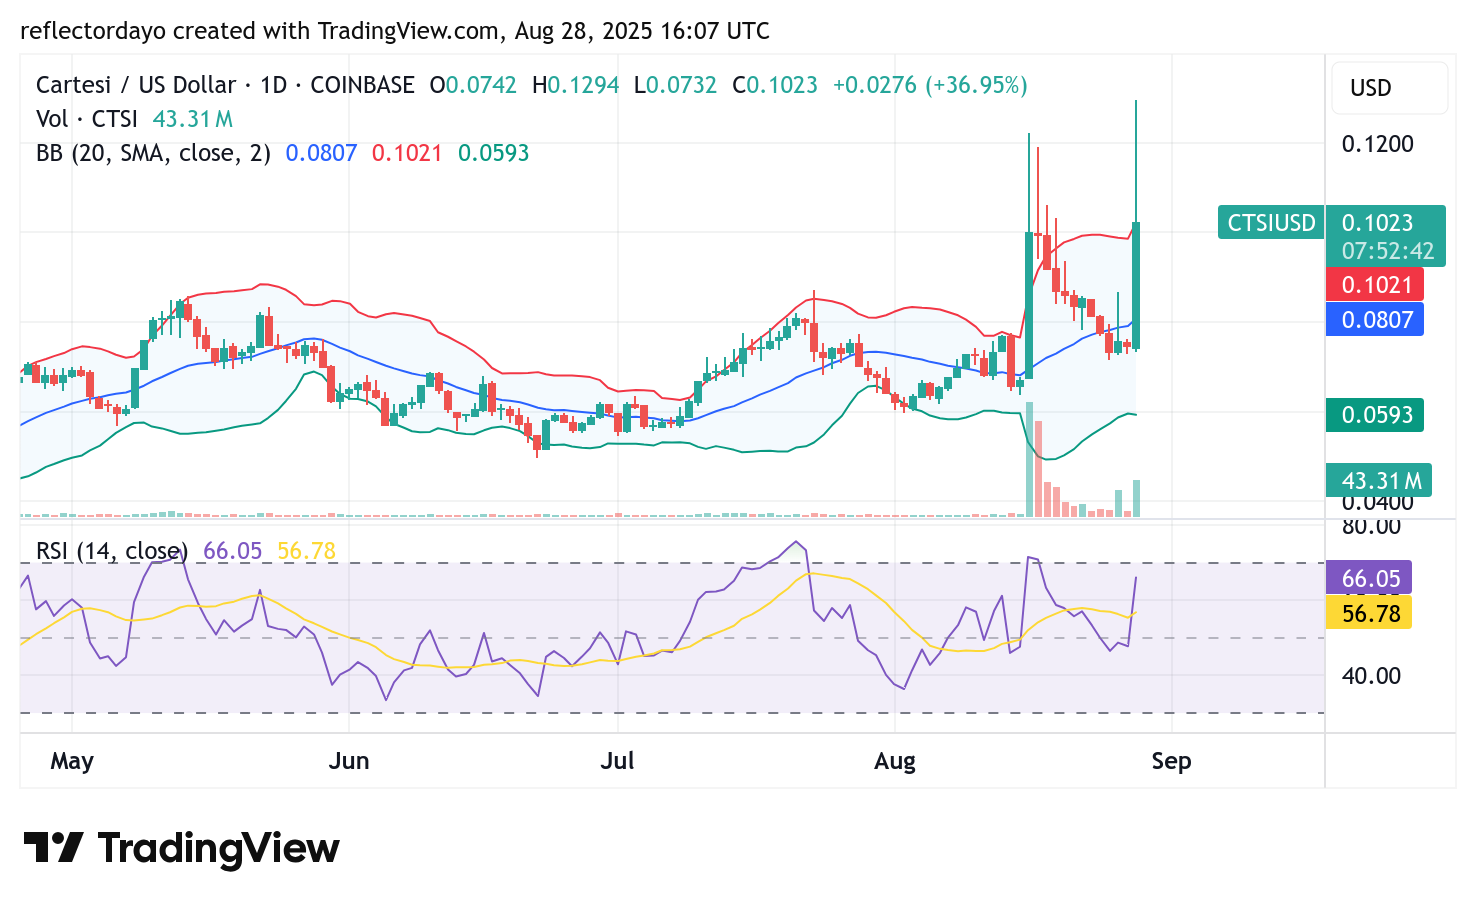
Daily Chart Outlook: Cartesi (CTSI)—Bulls Regain Control
Cartesi’s latest price surge is particularly notable, as it comes shortly after the market established support around the $0.074 level—marking a higher low following the recent bearish correction from $0.12. This higher low signals that bullish momentum is gradually regaining control.
The widening of the Bollinger Bands, fueled by ongoing bullish activity, suggests that strong and sharp price swings may continue. For now, the momentum is firmly to the upside, with buyers attempting to consolidate control around the $0.10 level. If the price holds above this key threshold, the next trading sessions in the crypto signal could see renewed bullish sentiment, potentially driving CTSI toward higher targets.

CTSI/USD 4-Hour Chart Outlook – Bulls Testing $0.10 as Key Support
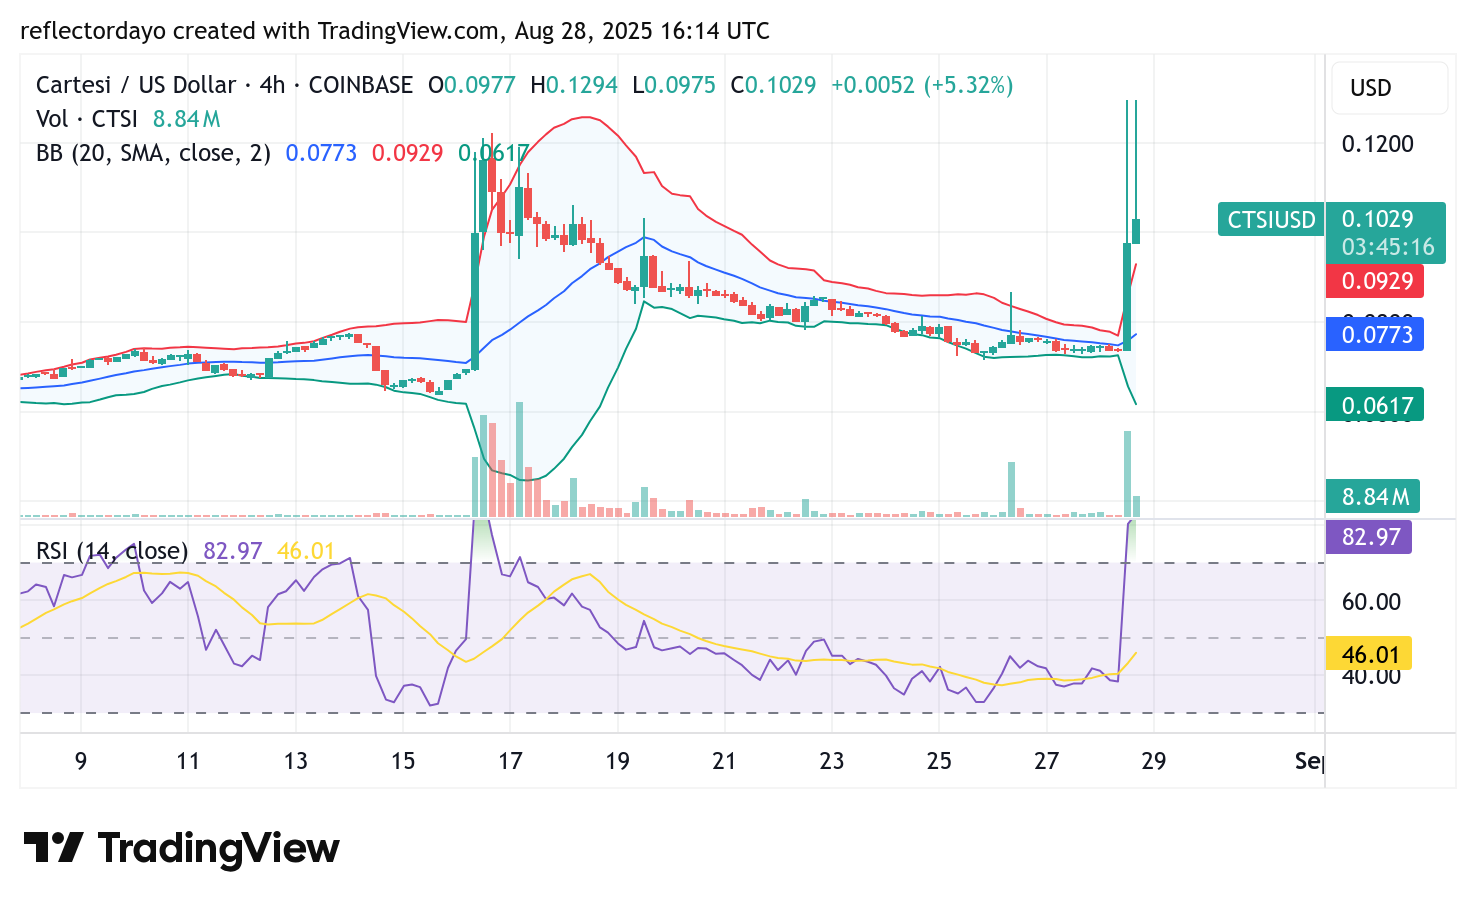
On the 4-hour chart, Cartesi (CTSI) shows a strong bullish trend with price action moving steeply upward. The RSI confirms this momentum, reflecting a near-vertical climb that quickly pushed the market into overbought territory—leaving it vulnerable to a corrective pullback.
Currently, bulls are attempting to defend the $0.10 level as a potential higher support zone. If this level holds, it could set the stage for renewed upside momentum. However, the ongoing candlestick is signaling a bearish reversal, raising the possibility of a deeper correction. Traders should approach cautiously and watch closely to see whether the $0.10 support is sustained.