Bitcoin (BTC/USD) Price Is Strengthening, Trading at $35,000
Estimated Reading Time: 3 minutes
Don’t invest unless you’re prepared to lose all the money you invest. This is a high-risk investment and you are unlikely to be protected if something goes wrong. Take 2 minutes to learn more
Bitcoin Price Prediction – November 1
Following the strong recovery path that bulls have demonstrated over a number of sessions in the operations of Bitcoin against the US currency, given that the crypto-economic trade is strengthening, traders are trading around the psychological resistance value of $35,000.
Due to inactive volatile forces at work, a series of smaller daily candlesticks have been appearing around the $35,000 mark, causing uncertainty. The market needs to correct itself at a slower pace to avoid creating any more historically large free falloffs. Buyers should be cautious in case the retracement moves past the Bollinger Band.
BTC/USD Market
Key Levels:
Resistance levels: $37,500, $40,000, $42,500
Support levels: $30,000, $27,500, $25,000
BTC/USD – Daily Chart
The BTC/USD daily chart showcases that the crypto-economic price is strengthening, trading around the value line of $35,000.
The stochastic oscillators have stretched northbound, tending to place back to maintain values from 78.40 to 69.60 points. The Bollinger Band trend lines are positioned at $37,320.46 and $31,334.57, and the lower part is at $25,348.68, respectively. The current formation of candlesticks has been formed to signify that movements to the upside will experience a round of pit stops.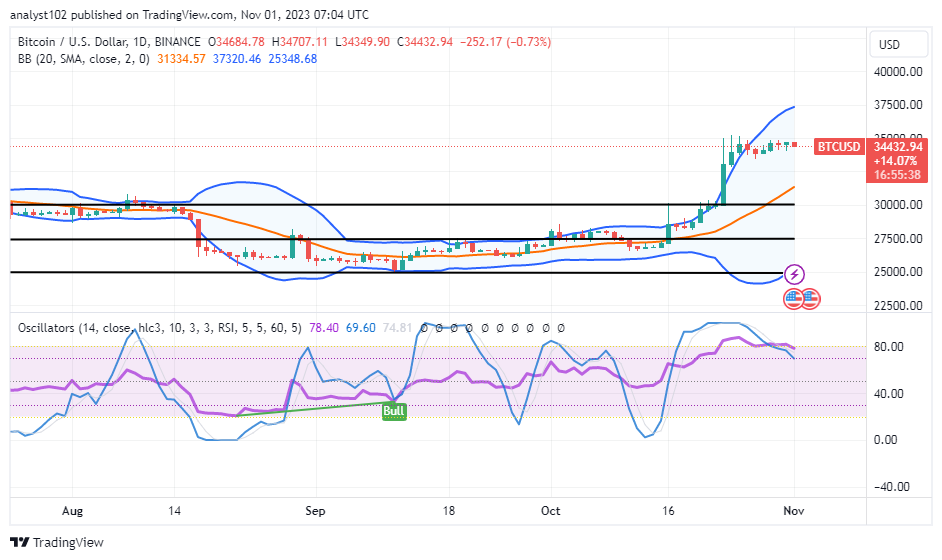
What state is the Bitcoin/USD market holding in relation to the current trend?
As of this technical write-up, the BTC/USD trade is going through a pause trading session, given that the crypto-economic price is strengthening, trading around the resistance line of $35,000.
Traders should exercise strategic positioning around the $35,000 bargaining spot. Successful stays above the point might result from a pull down from the value line coupled with a swift rebounding force. Furthermore, higher resistances above the $37,500 mark will be broken if the bulls maintain their firm support for the expected outcome.
Sellers need to be preparing to stage a resurgence around the $35,000 value line. The trade line is anticipated to function as the main area of deceleration where purchasers are anticipated to postpone for a while. Short-position placers are advised to support their entries with price action resulting from upward motions that timely resume correction input in the procession of that assumption tending to form.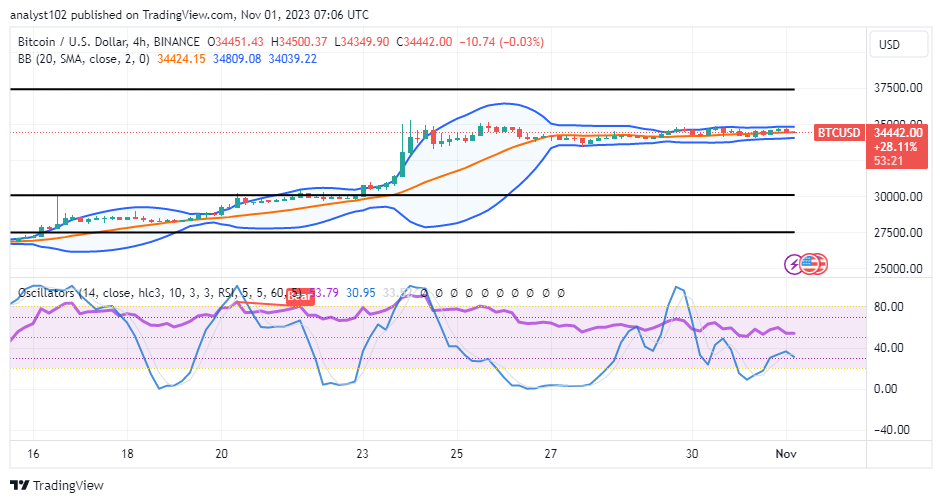
BTC/USD 4-hour Chart
The BTC/USD 4-hour chart shows the cryptocurrency market is strengthening, trading around the resistance line of $35,000.
From 53.79 to 30.95, the stochastic oscillators have been positioned southerly. The lower trend line of the Bollinger Band is at $34,039.22, and the upper trend lines are at $34,809.08 and $34,424.15. Bollinger bands and candlestick placement patterns indicate that tight-range movements are likely to occur.
Note: Cryptosignals.org is not a financial advisor. Do your research before investing your funds in any financial asset or presented product or event. We are not responsible for your investing results.
You can purchase Lucky Block here. Buy LBLOCK