Litecoin (LTC/USD) Market Plunges into a Downward Trend
Estimated Reading Time: 3 minutes
Don’t invest unless you’re prepared to lose all the money you invest. This is a high-risk investment and you are unlikely to be protected if something goes wrong. Take 2 minutes to learn more
Litecoin Price Prediction – January 11
There has appeared that there are a series of slow and steady falling pressures in the LTC/USD price valuation as the crypto-economic market plunges into a downward trend furthermore. The market continues operations from around $126, witnessing a higher value of about $131 and a lower value line of about $125. The crypto’s percentage rate is about 1.56 positives, as of writing.
LTC/USD Market
Key Levels:
Resistance levels: $150, $170, $190
Support levels: $120, $100, $80
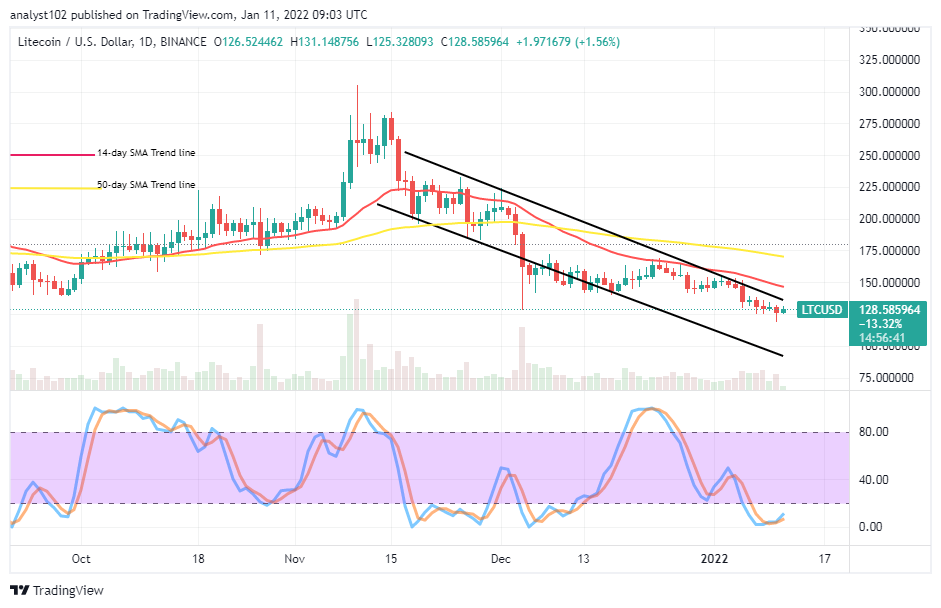
LTC/USD – Daily Chart
It is exhibited on the LTC/USD daily chart that the crypto-economic market plunges into a downward trend from an upper trend line of the bearish channels drawn. The 14-day SMA indicator is underneath the 50-day SMA indicator and, they both point toward the south direction above the current lower trading spot to indicate that the market succumbs to depression. The Stochastic Oscillators are in the oversold region with their lines seemingly trying to cross northbound within. That suggests that price may soon be finding stances to rally against the falling forces in the near time.
Are there indications the LTC/USD price will breach the $125 line successfully southward past as the crypto-economic market plunges into a downward trend?
It would be necessary that the LTC/USD traders wait for active actions of the market around the 14-day SMA indicator before making a decision. A notable sharp pulling down coupled with an immediate rebounding motion around that value line may, in the long run, give a better hedge in allowing bulls to get repositioned for a decent long order position.
On the downside of the technical analysis, the downward path as indicated by the 14-day SMA indicator and the upper bearish channel trend line drawn has to be respected by price by not breaking them out for sustainability. In other words, it means that the bearish motion has to continue for a while underneath the resistance trading line of $150. In the wake of the market trying more to consolidate around the $125 level, the trading pattern will witness variant lines of sideways situation afterward.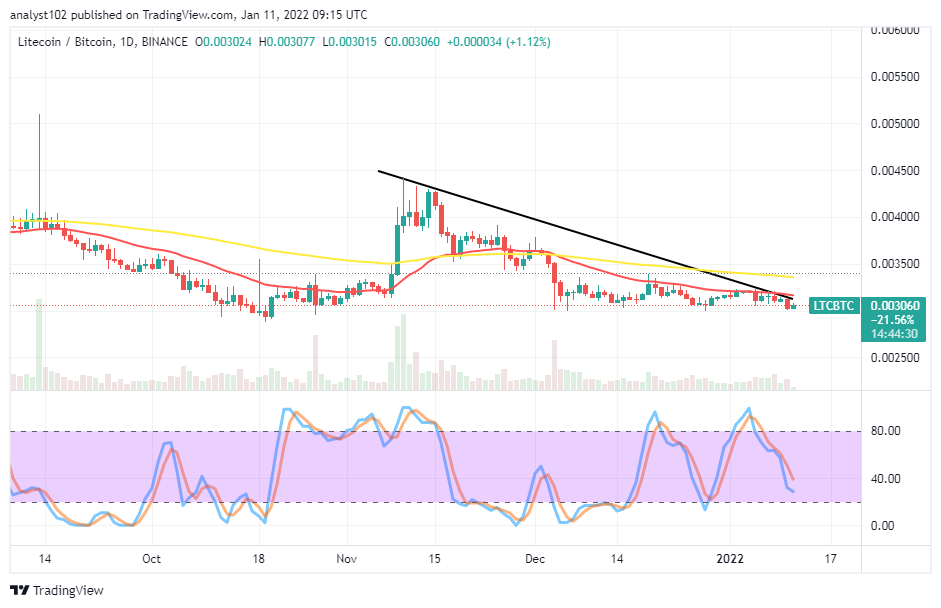
LTC/BTC Price Analysis
In comparison, it still indicated that Litecoin surrenders to falling forces inflicted on it by Bitcoin over a couple of sessions. The 50-day SMA trend line is above the 14-day SMA trend line. The bearish trend line drew southward across the bigger trading indicator to touch the smaller indicator at the end-point, placing a markdown sign at the current trading spot of the cryptocurrency pair trade. The Stochastic Oscillators southbound positioned slightly past the range of 40. It may take about fewer more days for the crypto pair to have a formation, confirming the possibility of the base trading tool regaining a stance as pairing with its counter trading instrument.
Note: Cryptosignals.org is not a financial advisor. Do your research before investing your funds in any financial asset or presented product or event. We are not responsible for your investing results.
You can purchase crypto coins here. Buy Tokens