Bitcoin (BTC/USD) Market Holds Around $50,000 and $45,000
Estimated Reading Time: 3 minutes
Don’t invest unless you’re prepared to lose all the money you invest. This is a high-risk investment and you are unlikely to be protected if something goes wrong. Take 2 minutes to learn more
Bitcoin Price Prediction – January 2
It has been for some time that the BTC/USD market holds in $50,000 and $45,000 variant lines. There is a symbolic bearish sign that the crypto economy suffers a setback as the price trades around $47,188 at a minute average rate of about 1.34 percentages negative.
BTC/USD Market
Key Levels:
Resistance levels: $52,500, $55,000, $57,500
Support levels: $45,000, $42,500, $40,000
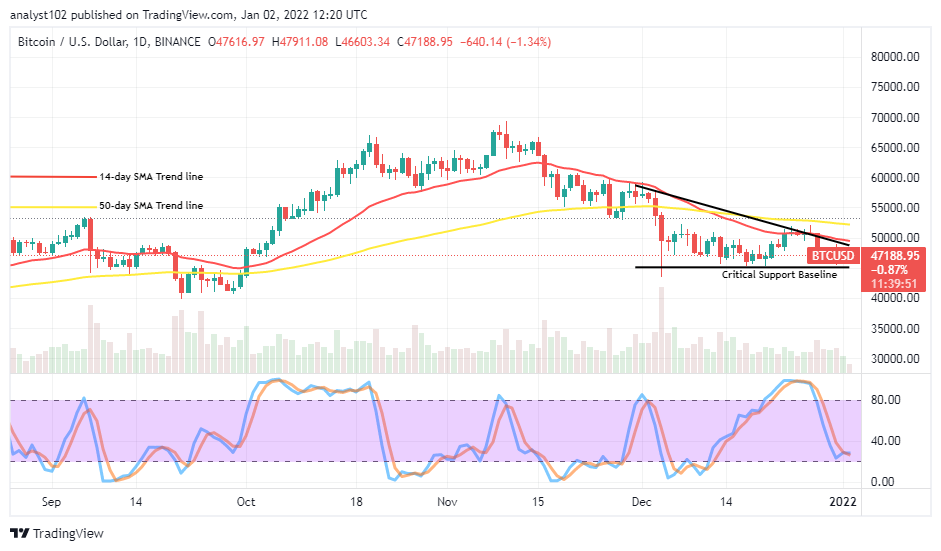
BTC/USD – Daily Chart
The BTC/USD January 2nd, 2022 chart reveals no difference in the business operations of the crypto versus the US coin as the market holds in $50,000 and $45,000 in an extension familiar to some of the recent past trading patterns. The 14-day SMA trend line is underneath the 50-day SMA trend line. The critical support baseline drew at the lower value line. The Stochastic Oscillators have closed the lines near above the range of 20. That could mean the crypto-economic price is pausing its operations for a while to push it in a definite direction.
Will the BTC/USD price consolidate its stances near above the critical baseline as the market holds in $50,000 and $45,000?
A long consolidation of the price above the critical baseline may, in the long-term run, degenerate into a falling force as the market holds in $50,000 and $45,000. An early reversal of a sudden downward movement against the lower value line will give a brighter hope, getting some up-stride motions in that process. In the bid of elongating the crypto-economic recovery movement, a bullish still needed to sustainably break out the resistance trading zone around $50,000 to place the trade back on the path of mooning for some more other time.
On the contrary to the upside technical analyses, the resistance trading levels are noted to be between $50,000 and $55,000. And, around or within those two value lines, price is likely to encounter descending forces capable of militating against smooth upswings. However, that scenario may not materialize in the near session. The BTC/USD market short-position takers should be wary of following a sudden fearful breakdown at the $45,000 critical support baseline.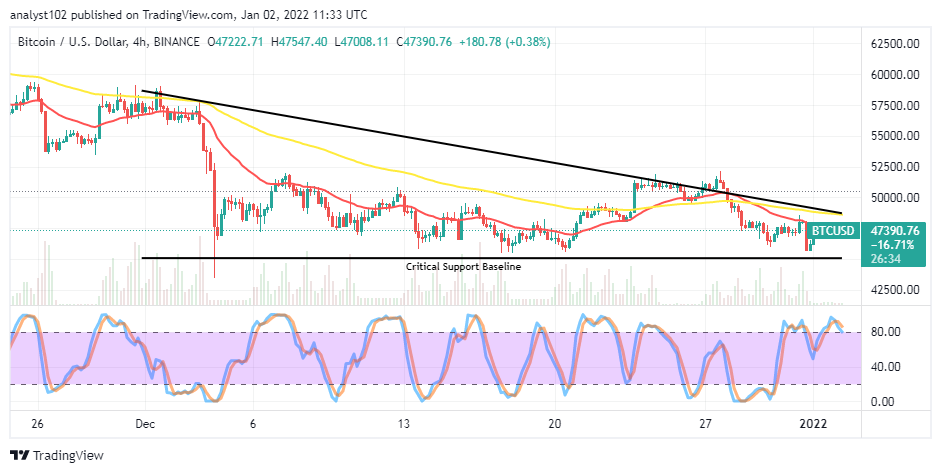
BTC/USD 4-hour Chart
The BTC/USD medium-term chart also shows that the crypto market holds in $50,000 and $45,000 since several couples of sessions as a critical support baseline drew at the lower value line. The 14-day SMA indicator positions tightly around $47,500, denoting it as the main trading point presently and, the 50-day SMA is above it. The Stochastic Oscillators have slightly crossed the lines southbound close above the range of 80. That is an indication the crypto’s price may still experience some falling movements in the near time against the smaller trend line area.
Note: Cryptosignals.org is not a financial advisor. Do your research before investing your funds in any financial asset or presented product or event. We are not responsible for your investing results.
You can purchase crypto coins here. Buy Tokens