Polygon (MATIC/USD) Market Resorts to Light Moves at $0.80
Estimated Reading Time: 3 minutes
Don’t invest unless you’re prepared to lose all the money you invest. This is a high-risk investment and you are unlikely to be protected if something goes wrong. Take 2 minutes to learn more
Polygon Price Prediction – December 25
The MATIC/USD market presently resorts to light moves around the trading point at $0.80. Buying and selling activities have faintly been around the low and the high of $0.794 and $0.799, keeping an average minute percent of 0.13.
MATIC/USD Market
Key Levels
Resistance levels: $0.85, $0.95, $1.05
Support levels: $0.75, $0.70, $0.65
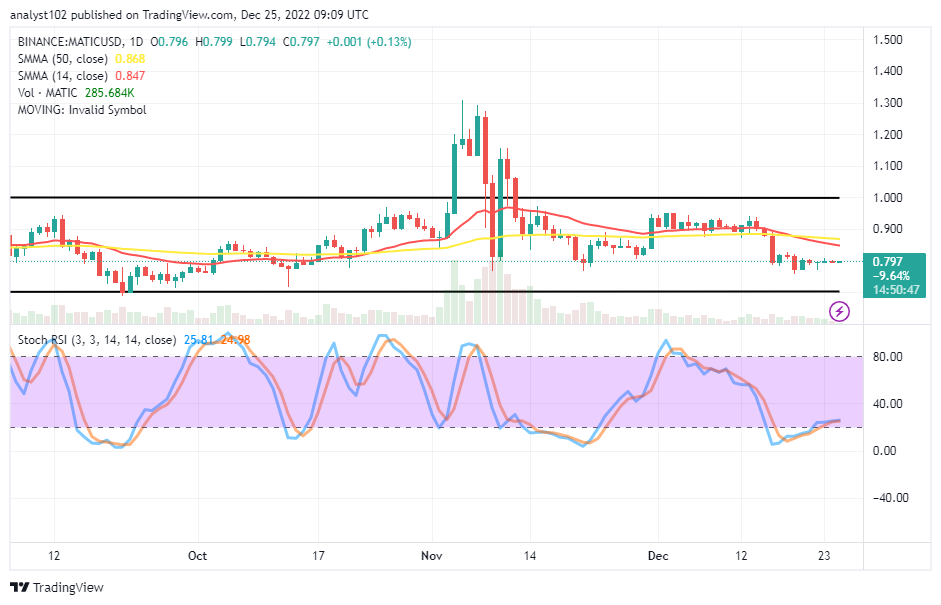
MATIC/USD – Daily Chart
The MATIC/USD daily chart showcases the pairing trading instrument resorts to light moves characterized by lower highs around the $0.80 point. The horizontal lines are around the upper number of $1 and the lower value at the $0.70 support level. The 14-day SMA indicator has briefly crossed southbound against the 50-day SMA indicator. And they are keeping $0.847 and $0.868 points. The Stochastic Oscillators have slantingly positioned northbound from the oversold region to 24.98 and 25.81 levels.
Will the MATIC/USD market continue to feature light moves around the $0.80 trading line?
Traders will have to look for active price motions in the MATIC/USD trade activities as the crypto’s price resorts to light moves around the $0.80 level. The expected move has to be mainly to test support around the lower range spot at $0.70 to reproduce an upswing alongside the course to allow long-position placers to possess a timely re-launching of buying orders afterward.
On the downside of the technical analysis, there has been no clear indication that the MATIC/USD market will change its current direction in a more defined way. Based on that presumption, trade movers are liable to remain indecisive for some time between the values of the SMAs and the lower range point at $0.70. The transactions tend to feature between $0.90 and $0.70 value lines if there is a need for sideways trading sessions to prolong. Placers of short positions should be cautious when continuing the downward trend toward the lower endpoint.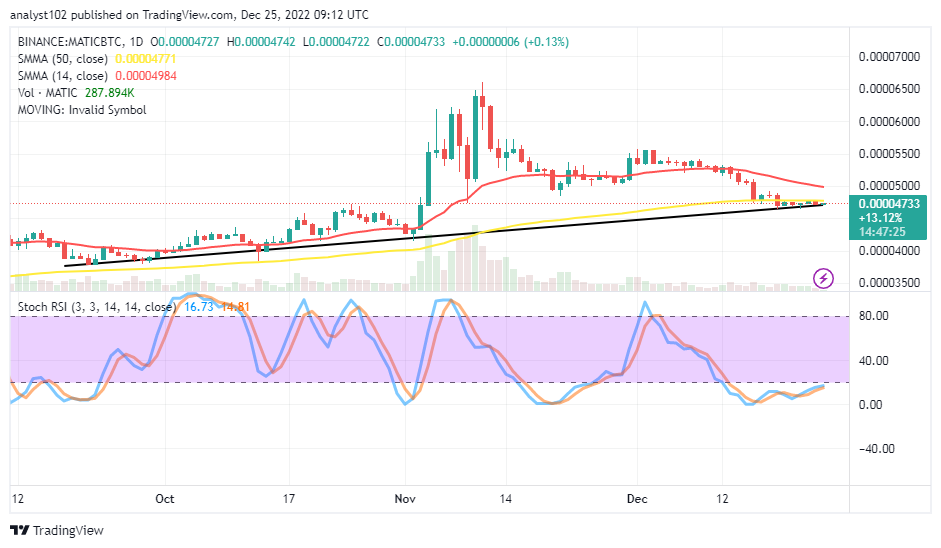
MATIC/BTC Price Analysis
In contrast, Polygon appears to be keeping a push against Bitcoin on an upward trajectory. The cryptocurrency market resorts to light moves around the bullish trend line drawn around the bigger SMA. The 14-day SMA indicator is over the 50-day SMA indicator. The Stochastic Oscillators have crossed briefly northbound from the oversold region to 14.81 and 16.73 levels, indicating the degree of positive response the base crypto has made, pairing with the trending ability of its counter-trading crypto.
Note: Cryptosignals.org is not a financial advisor. Do your research before investing your funds in any financial asset or presented product or event. We are not responsible for your investing results.
You can purchase Lucky Block here. Buy LBLOCK