BNB (BNB/USDT) Struggles to Maintain Bullish Momentum
Estimated Reading Time: 3 minutes
Don’t invest unless you’re prepared to lose all the money you invest. This is a high-risk investment and you are unlikely to be protected if something goes wrong. Take 2 minutes to learn more
BNB Long-term Analysis: Bullish
The market for BNB against the USDT has faced increased selling pressure despite a notable uptrend in previous sessions. This has resulted in a correction with the green Exponential Moving Averages (EMAs) converging alongside price towards the red EMAs.
Recent price actions suggest a critical phase, as the pair sees a 3.35% weekly dip. The other indicator on the chart indicates that the price may test immediate support in the near term.
Currently, BNB trades at $645.04 with traded volume under 270 thousand.

Technical Indicators
Major Resistance Levels: $670.20, $700.00, and $720.00
Major Support Levels: $620.00, $600.00, and $570.00
BNB Technical Analysis
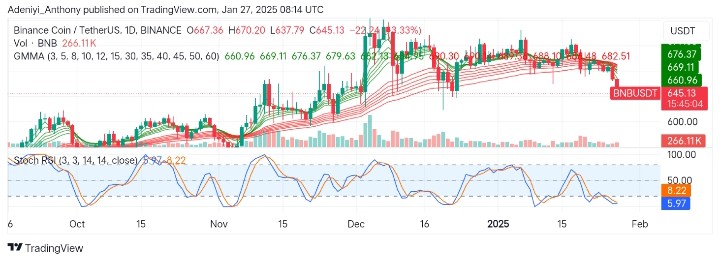
The market for BNB against the Tether on the weekly timeframe remains cautiously optimistic, with price hovering around the shorter-period EMAs. The Guppy Multiple Moving Averages indicate a slight contraction, suggesting reduced bullishness as the two sets of EMAs converge.
However, as the price ranges between $670 and $637.79, the traded volume suggests no definitive movement as the pair shows resilience above critical support.
To this end, the Stochastic RSI signals an oversold condition for the BNB with the potential of resuming momentum in the near term. Therefore, the price needs to break above $670.20 with increasing volume for bullish continuation; otherwise, contraction of the GMMAs and further decline in the value of the Stochastic RSI would signal a further decline in price.
BNB/USDT Analysis: What’s Next?
In a shorter timeframe, BNB/USDT appears to be correcting as the pair faces rejection at around the $670 resistance level. This rejection highlights the existence of strong bearish pressure as the bullish traders struggle to stabilize the market.
The current price action below the GMMAs indicates a bearish-dominated situation. However, the Stochastic oscillator, which reads extreme oversold values, suggests a high probability of a near-term bounce.
To this end, traders should wait for confirmation above $660.96 to take a long position; otherwise, a break below $620 could heighten the selling pressure.
You can purchase crypto coins here. Buy LBlock