Helium (HNT/USD) Market Faces Stiff Resistance at $6.00
Estimated Reading Time: 3 minutes
Don’t invest unless you’re prepared to lose all the money you invest. This is a high-risk investment and you are unlikely to be protected if something goes wrong. Take 2 minutes to learn more

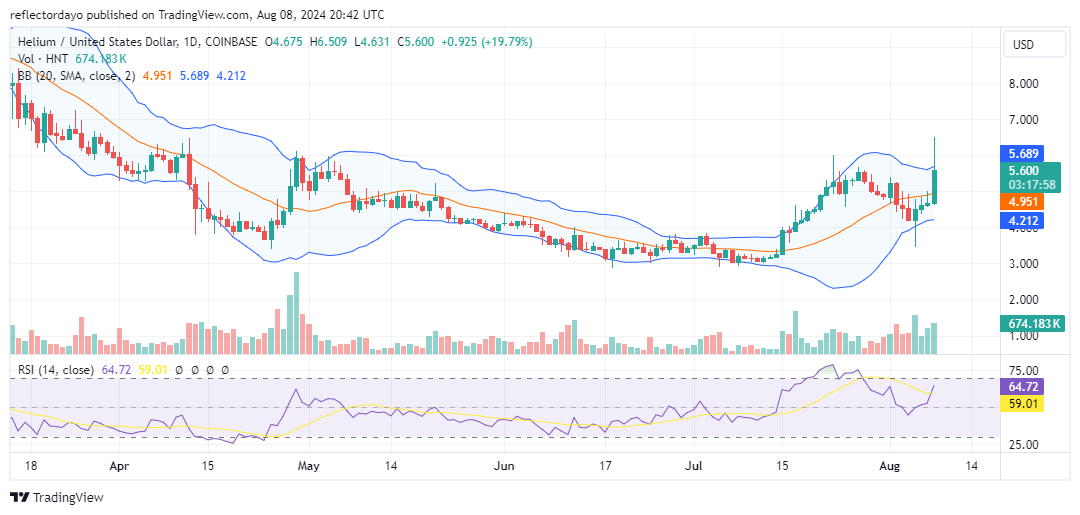
The helium market witnessed a steady and substantial increase in July, reaching a peak at the $6.00 price level. After encountering resistance at this point, a selloff trend emerged as investors engaged in profit-taking. This crypto signal resulted in a price decline, which eventually found support at the $4.00 level. From this higher support level, the market regained momentum and surged back towards the $6.00 mark.
The Helium Market Data
- HNT/USD Price Now: $5.619
- HNT/USD Market Cap: $894 million
- HNT/USD Circulating Supply: 161 million
- HNT/USD Total Supply: 161
- HNT/USD CoinMarketCap Ranking: #68
Key Levels
- Resistance: $6.00, $6.50, and $7.00
- Support: $4.00, $3.50, and $3.00.
The Helium Market Through the Lens of Indicators
This time, the helium market briefly surged above the $6.00 price level, testing the $6.50 mark. However, due to the impact of the previous profit-taking at this level, traders have been closely monitoring the $6.00 level as a critical point of interest. This attention explains the subsequent price correction, which brought the market down from $6.50 to $5.60.
Despite this correction, the bullish trend has continued throughout the trading session. The upper band of the Bollinger Bands indicator has responded to the strong bullish activity, pushing the market higher. This current bullish momentum is supported by substantial trading volumes, as indicated by the significant histograms, reinforcing the strength of the ongoing bull market.
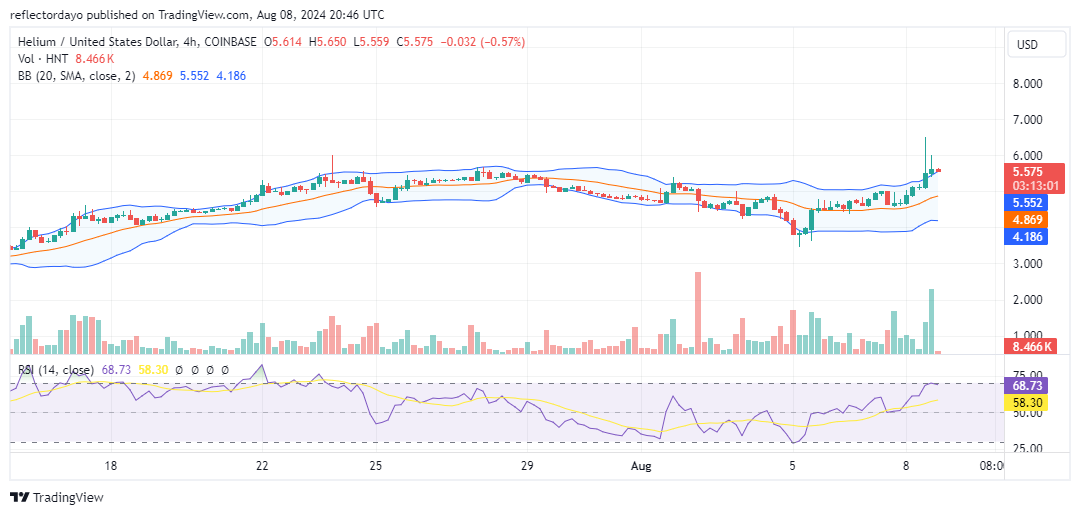
HNT/USD Price Prediction: 4-Hour Chart Analysis
The recent candlestick patterns observed in the 4-hour trading session suggest a potential shift in the market toward bearish momentum. We have already seen two shooting star candlesticks, with the second one exhibiting a much shorter upper shadow. This sequence of shooting stars indicates a buildup of bearish sentiment.
However, despite the implication of a possible bearish move, the most recent candlestick is very small, signaling indecision and a tug-of-war between demand and supply. If this indecision persists, the market may consolidate around the $5.56 level. Given the bullish strength that the market has demonstrated recently, there is a possibility that it may resume its upward trajectory.