The SPONGE/USD ($SPONGE) Price Is on the Rise
Estimated Reading Time: 3 minutes
Don’t invest unless you’re prepared to lose all the money you invest. This is a high-risk investment and you are unlikely to be protected if something goes wrong. Take 2 minutes to learn more
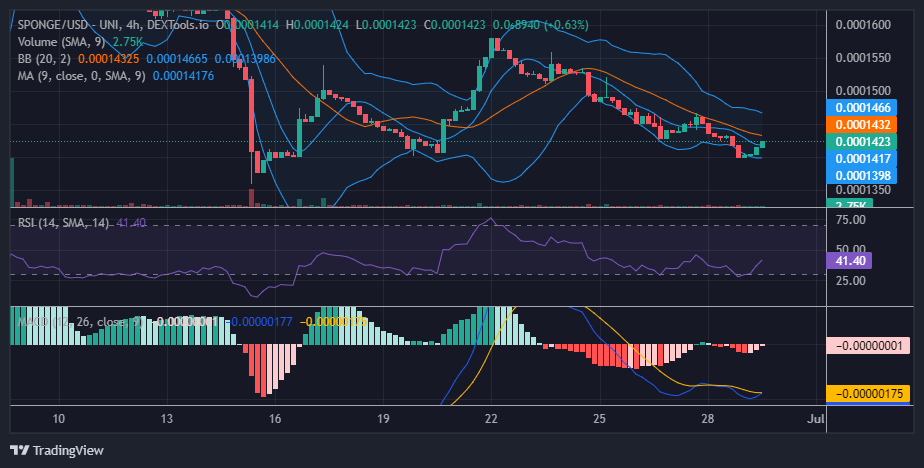
Towards the end of the previous daily trading session, the bearish price of the SPONGE/USD pair reached the $0.00014 support price level. However, its strong bear market could not go any further beyond the demand level. At this point in the market, the traders are ready to buy again, so the price rises from here.
Key Levels
- Resistance: $0.0004, $0.0045, and $0.0005.
- Support: $0.00015, $0.00014, and $0.00013.
Sponge (SPONGE/USD) Price Analysis: The Indicators’ Point of View
In the SPONGE/USD market, the two lines of the Moving Average Convergence and Divergence (MACD) indicator have already crossed each other in the negative zone. That is to signal that the market is now changing direction.
The first resistance level on its way is the $0.0001434 price level, and the current price at $0.0001417 is represented by a marubozu candlestick pattern. This shows that bulls are currently dominating the market, and $0.0001434 resistance may not stand a chance.

Sponge Short-Term Outlook: 1-Hour Chart
In the 1-hourly timeframe, the SPONGE/USD market has crossed into the bullish zone in the Bollinger Bands indicator and the Relative Strength Index (RSI). But in the Moving Average Convergence and Divergence (MACD) indicator, the price action is just about crossing out of the bearish zone, but the histograms are progressive.
However, resistance seems to be forming too soon around $0.0001423. The volume of the trade histogram representing the current 1-hour session is a little bit noticeable and significant, but the current candlestick appears as a 4-price doji. That is a sign of intense struggle and indecision at that point. However, going by the indicator, the SPONGE/USD bulls are having the upper hand, and the $0.00015 price level might be the next bullish target.
SPONGEUSD is live on gate.io
🌊Immerse yourself in the world of $SPONGE by trading it on @gate_io! 🚀
🧽The ultimate #MemeCoin that allows all #Sponge enthusiasts to soak up the damp!💧🌊
🧽Dive in now at🔗⬇️https://t.co/lDGSBf8kaO pic.twitter.com/Uuc03s2FkD
— $SPONGE (@spongeoneth) June 29, 2023
Invest in the hottest and best meme coin. Buy Sponge ($SPONGE) today!