Polygon (ex-MATIC) Price Prediction: POL/USDT Floats Above the $0.3126 Threshold
Estimated Reading Time: 3 minutes
Don’t invest unless you’re prepared to lose all the money you invest. This is a high-risk investment and you are unlikely to be protected if something goes wrong. Take 2 minutes to learn more

Polygon (ex-MATIC) Price Prediction for November 2
Over the past eight sessions, price action in the Polygon (ex-MATIC) market has taken a steeper dive, bringing the market lower. Currently, the market is hovering around the $0.3126 support level. Additionally, trading indicators aren’t showing much optimism about short-term price movements. Let’s take a closer look at the market.
POL/USDT Long-term Trend: Bearish (Daily Chart)
Key Price Levels:
Resistance: $0.3500, $0.4000, $0.4500
Support: $0.3000, $0.2500, $0.2000
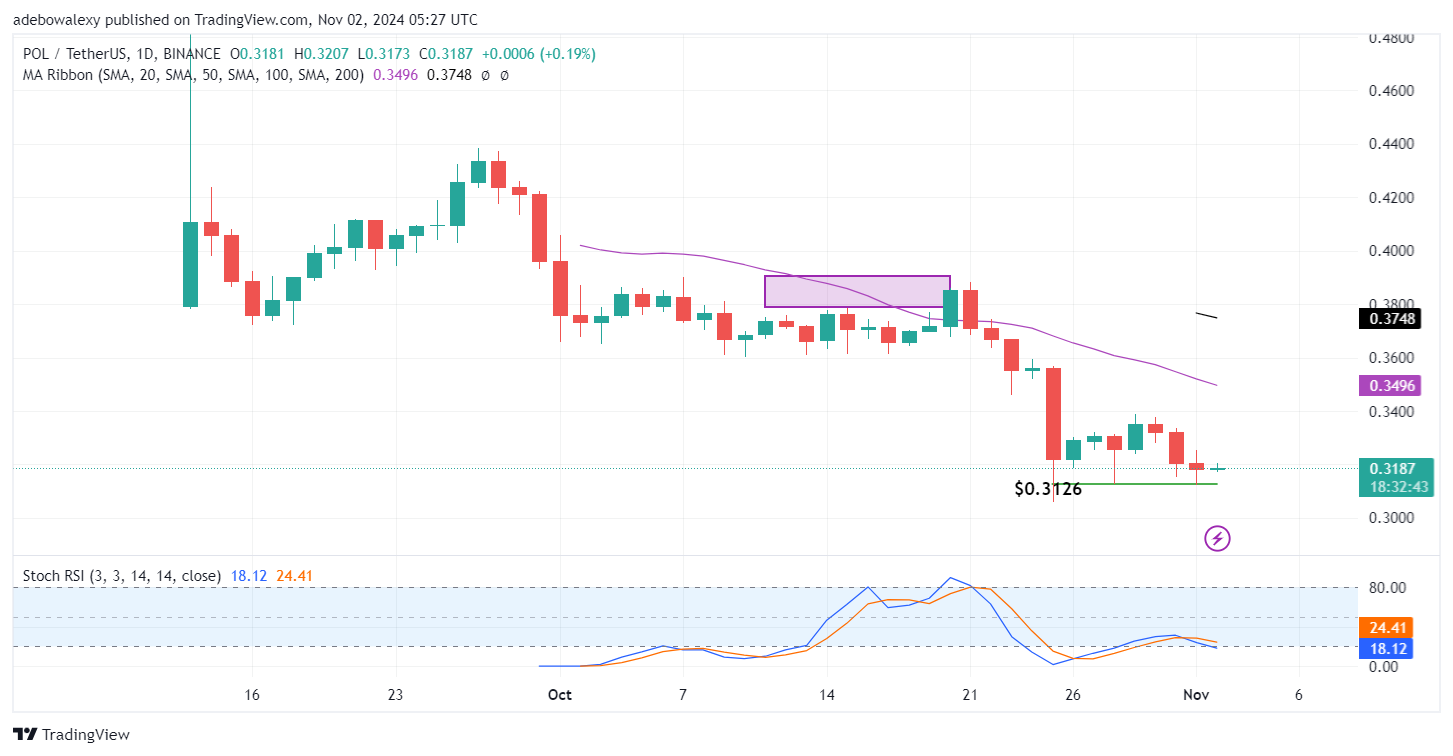
Recently, price action in the POL/USDT daily market approached the $0.3126 support level once more. However, the ongoing session appears to be limiting further price declines. The last price candle appears as a green doji, keeping the market above the mentioned threshold. Meanwhile, all of this activity remains below the 20- and 50-day Moving Average (MA) lines. At the same time, the Stochastic Relative Strength Index (RSI) lines are trending slightly downward, below the 40 level.
Polygon (ex-MATIC) Price Prediction: POL/USDT Market Needs a Stronger Catalyst
Although upside forces in the POL/USDT market may have halted the downward retracement, the market remains vulnerable. This assessment stems from the fact that price action remains below all MA lines. Additionally, although the price candle for the ongoing session has turned green, it presents weak resistance to downward forces due to its small size.
Furthermore, the trajectory of the Stochastic RSI lines does not suggest much positivity. As it continues to trend slightly downward, the terminal part of the lines is not approaching a crossover. Therefore, it may be premature to make bullish speculations for this market at this time.
Polygon (ex-MATIC) Price Prediction: POL/USDT Upside Forces Continue to Resist Headwinds (4-Hour Chart)
In the 4-hour Polygon (ex-MATIC) market, signs suggest that upside forces are persistently resisting downward retracements. For the past two sessions, this market has been trending sideways in an almost straight line. The last two price candles on this chart are green and resemble spinning tops. Meanwhile, the Stochastic RSI lines continue to trend upward, even though price action remains below all MA lines.
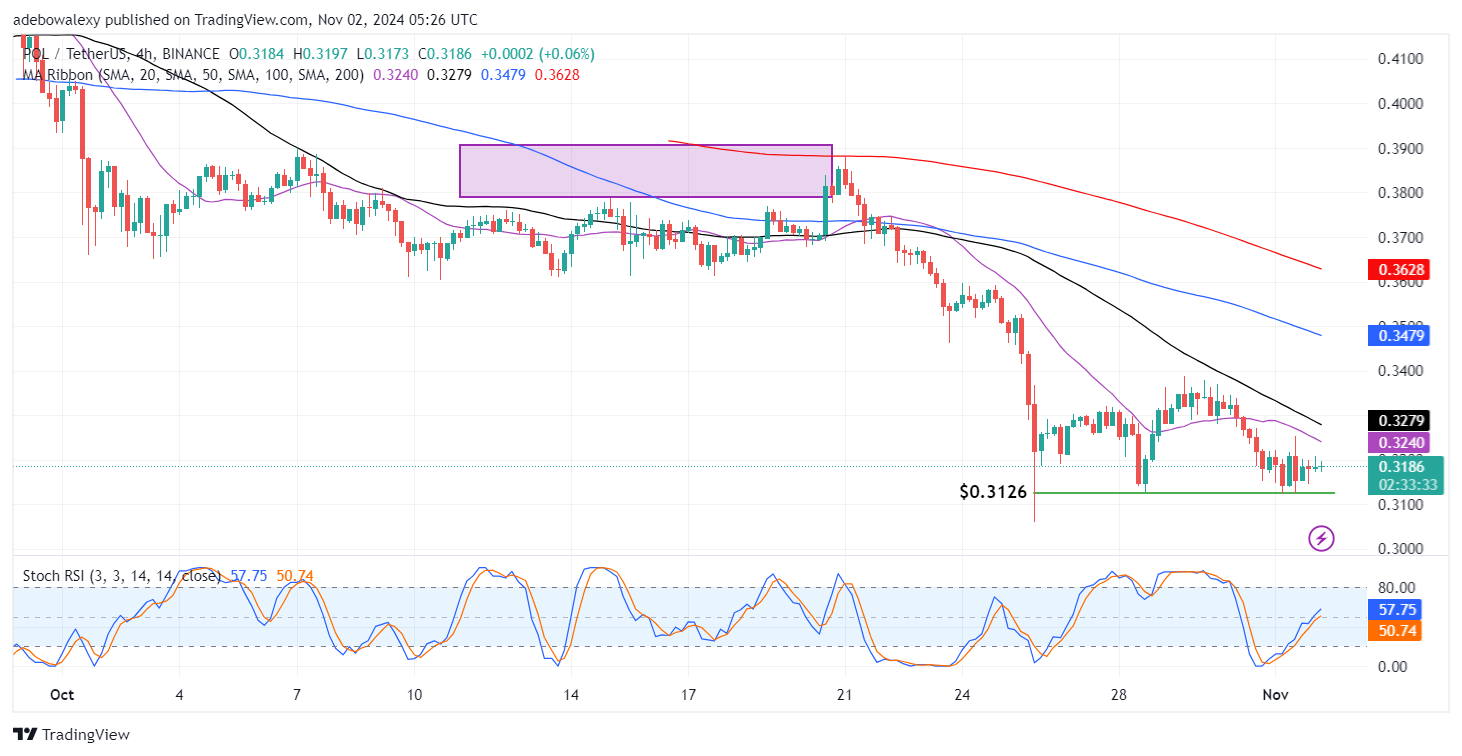
Available indications in this market point to the presence of resistance at this level, and this resistance appears to be persisting. Nevertheless, price activity remains below all MA curves. Consequently, this market needs more participation; otherwise, the downward retracement may continue toward the $0.3000 price level.