Polygon (MATIC/USD) Trade Tends a Correction, May Revisit $0.7
Estimated Reading Time: 3 minutes
Don’t invest unless you’re prepared to lose all the money you invest. This is a high-risk investment and you are unlikely to be protected if something goes wrong. Take 2 minutes to learn more
Polygon Price Prediction – February 4
Variant activities have been surfacing to depict that the MATIC/USD trade currently tends toward a correction as it may risk revisiting the line of $0.7 in the long run.
According to psychological theories, the market is currently experiencing a depression, which is pushing prices lower across a range of values around the middle Bolinger Band’s trading axis. Even after any likely attempt to surge past the zone of the upper Bollinger Band in the long run, the $0.80 line seems to be a real-time resistance location where long-position placers have to add additional muscles to breakthrough more overhead resistance lines.
MATIC/USD Market
Key Levels:
Resistance levels: $0.90, $1, $1.10
Support levels: $0.70, $0.65, $0.60
MATIC/USD – Daily Chart
The MATIC/USD daily chart showcases the crypto market tending to a correction, and it may in the long run revisit the point of $0.7.
The decline velocity on the market pace has been such that it produces a series of candlesticks, marking that the journey to the upside is going to be put to a check for a while. The Bollinger Band trend lines are still in a relatively southward bending mode to partially represent a bullish flag shape. The stochastic oscillators have been gradually portending a southward slanting pattern to denote that a falling pressure is in a composure style.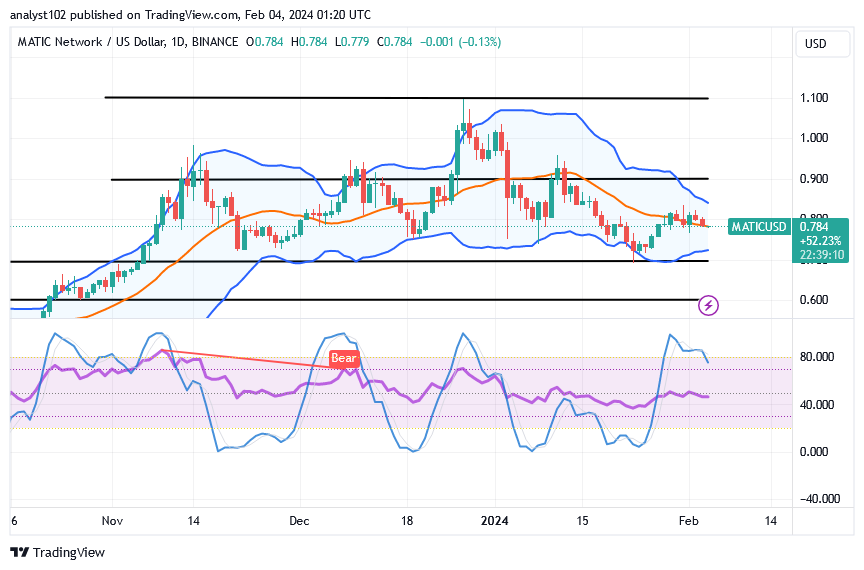
Is it ethically OK for consumers to hold off on purchasing new pushes until after this piece?
A brief-oriented decline force has tentatively surfaced on the market to denote that shorting motion is going to be for a while, given that the MATIC/USD trade tends a correction, as it may revisit the point of $0.7.
Probably around $0.8, bulls will be able to hold off until the exchange line regains a bounce signal from a significant lower-trading spot if there is a lack of active positive price composure. In the wake of operations, long-position placers must reposition themselves from the lower Bollinger Band in order to offset any potential drops above the bottom portion of the indicators’ line.
The range of circumstances between the middle and upper Bollinger Band trend lines has been reset for orders to yield in a shorting position. To provide a quick explanation of that prediction, stop-loss orders will be set based on points between $0.9 and $0.8.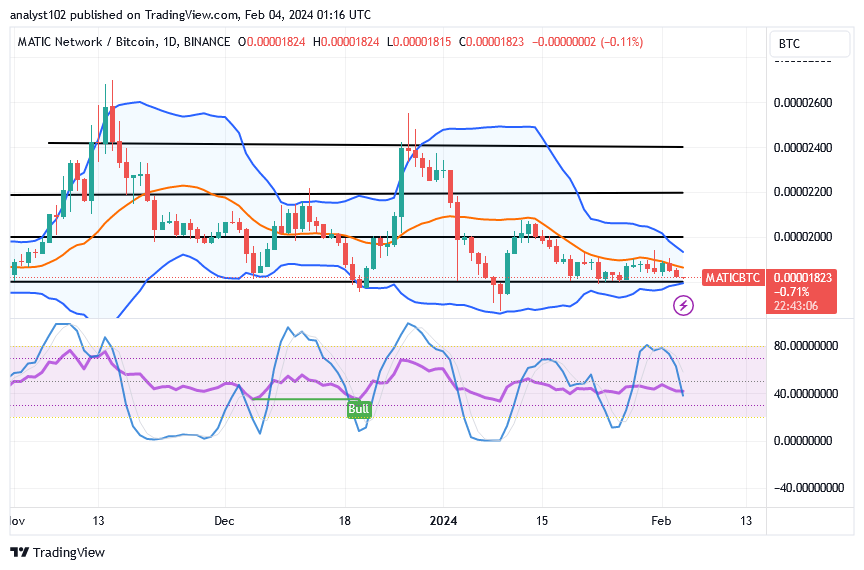
MATIC/BTC Price Analysis
In comparison, the Polygon trade tends a correction against the capacity of Bitcoin, and the forces could still go further to revisit a number of lower lows closely underneath the lower Bollinger Band.
The stochastic oscillators are in a slight southward crossing mode to denote that the shorting force is on the verge of attempting to go into the oversold region. The Bollinger Band trend lines are place in a manner to showcase that the falling candlesticks are reaching for an end at a low pace. It is important for a bullish candlestick to surface to give back logical longing entry.
Note: Cryptosignals.org is not a financial advisor. Do your research before investing your funds in any financial asset or presented product or event. We are not responsible for your investing results.
You can purchase Lucky Block here. Buy LBLOCK