Polygon (MATIC/USD) Price Goes Declining, Finding Support
Estimated Reading Time: 3 minutes
Don’t invest unless you’re prepared to lose all the money you invest. This is a high-risk investment and you are unlikely to be protected if something goes wrong. Take 2 minutes to learn more
Polygon Price Prediction – April 7
Some forces have popped up against bulls pushing freely beyond the sell signal side of the Bollinger Band recently as the MATIC/USD trade is declining, finding support around the lower Bollinger Band trend line.
Investors may once again start executing variation-longing trade positions as the market has been forced to settle for another round of establishing its postures from that reduction trading location. This is because it is vital to view it as an opportunity to obtain another window of opportunity in the purchasing approach.
MATIC/USD Market
Key Levels:
Resistance levels: $1, $1.10, $1.20
Support levels: $0.85, $0.80, $0.75
MATIC/USD – Daily Chart
The MATIC/USD daily chart reveals that the crypto business is declining, finding support around the trending pathway of the lower Bollinger Band.
The Bollinger Band trend lines have been constrained to slightly bend downward, keeping higher exchange lines between $1.10 and $0.90. The stochastic oscillators have been forced to pull down into the oversold with a new sign of trying to point back to the north. That is signaling that the base instrument is gradually recuperating.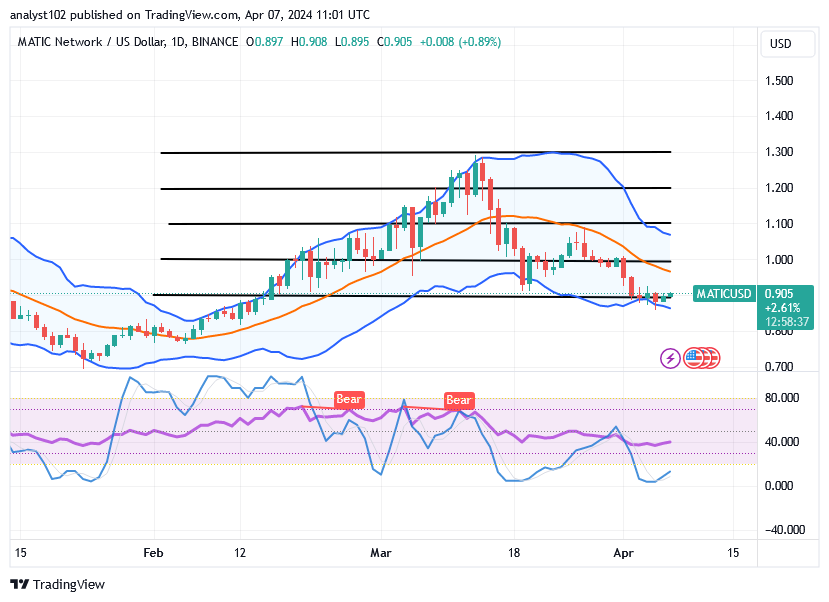
If, at this point in time, a reversal move tends to occur against the lower Bollinger Band, should the MATIC/USD market bulls hold off completely?
We do not expect to see stable fall-offs beneath the lower Bollinger Band trend line at this point, given that the MATIC/USD market is declining and finding support around the indicator’s trending path.
Buyers should start making different comebacks if that assumption is correct, even though there may still be a sort of prolongation process that results in subsequent lower lows. Investors hoping to liquidate soon won’t benefit much from the current state of the cryptocurrency market before the anticipated large bull run that is expected to occur shortly.
If the price tends to draw back abruptly from the lower Bollinger Band at this moment, it might be a signal to bears to avoid taking unnecessary risks because a quick rebound could signal the end of the corrections that have been made. Between the middle and the higher Bollinger Band, a safer entry is seen if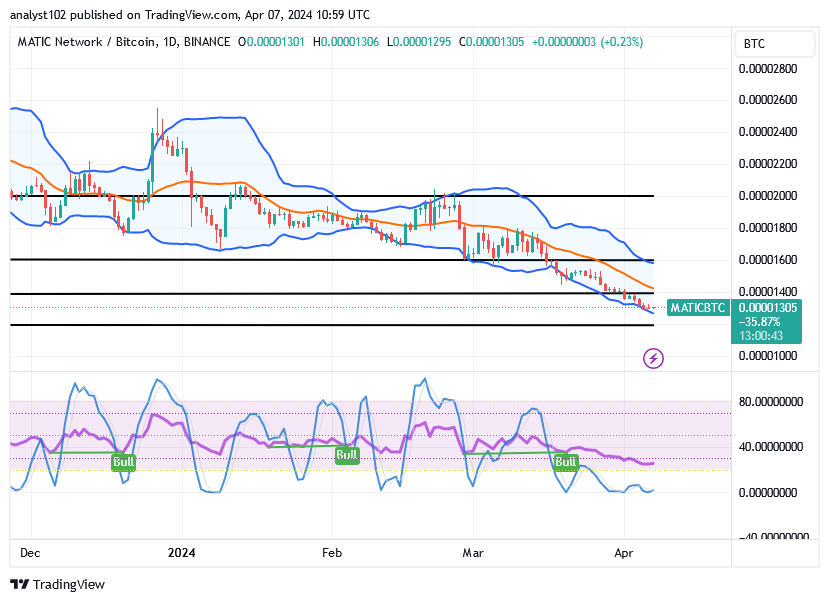
MATIC/BTC Price Analysis
In comparison, Polygon, as the base crypto market against Bitcoin, has been declining and finding support.
The downward pressure on the mode of movements has been consistently present at the lower Bollinger Band, preventing any meaningful bullish candlestick formation. In order to indicate that a force is still holding against recovery motion on a tentative basis, stochastic oscillators are also currently being discovered in the oversold region.
Note: Cryptosignals.org is not a financial advisor. Do your research before investing your funds in any financial asset or presented product or event. We are not responsible for your investing results.
You can purchase Lucky Block here. Buy LBLOCK