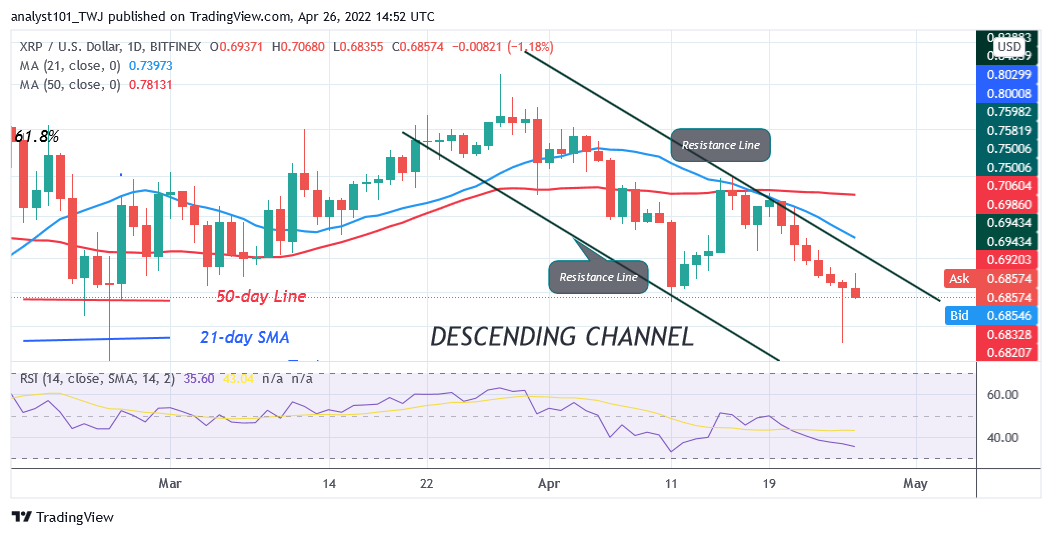
Ripple Declines to $0.62 Low as Bears Threaten To Reach $0.54 Low
Estimated Reading Time: 2 minutes
Don’t invest unless you’re prepared to lose all the money you invest. This is a high-risk investment and you are unlikely to be protected if something goes wrong. Take 2 minutes to learn more

Free Crypto Signals Channel
Ripple (XRP) Long-Term Analysis: Bearish
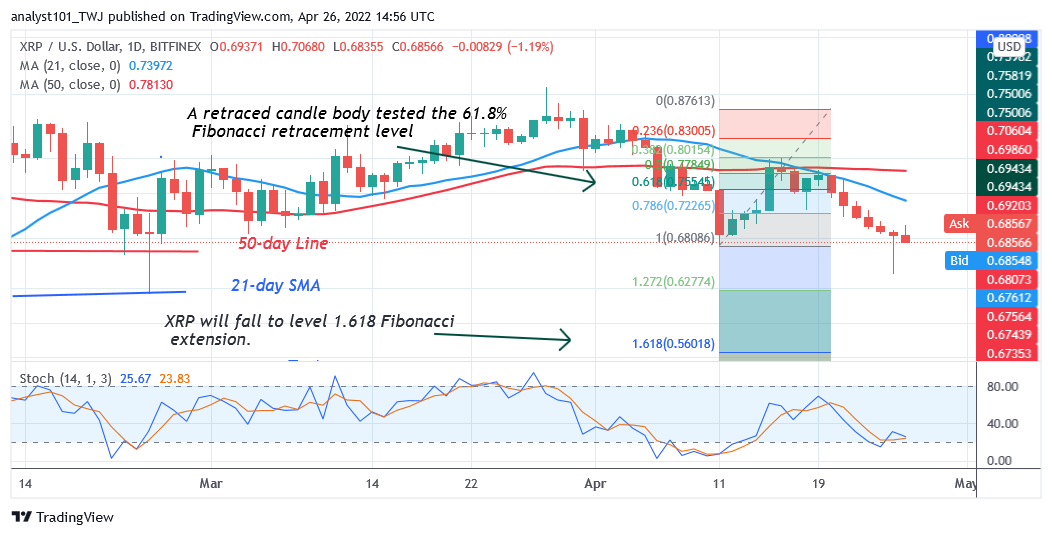
Ripple’s (XRP) price is in a downtrend as sellers threaten to reach $0.54 low. The bears broke below the current support at $0.68 price levels. It appears the current push will extend to the previous lows. In other words, if the bears successfully break the current support, XRP/USD will decline to the lows of either $0.59 or $0.54. Conversely, if the altcoin holds and rebounds above the current support, XRP will rally to the $0.80 high. However, if the crypto’s price breaks above the moving averages, XRP will continue to push to the previous high of $0.90. Meanwhile, Ripple is trading at $0.65 as of press time.
Ripple (XRP) Indicator Analysis
Ripple has fallen to level 32 of the Relative Strength Index for period 14. Ripple has reached the oversold region of the market. The crypto’s price is below the moving averages which are responsible for the current price fall. The altcoin is below the 20% range of the daily stochastic. It indicates that the market has reached reaching bearish exhaustion. The 21-day line SMA and 50-day line SMA are sloping downward indicating the downtrend.
Technical indicators:
Major Resistance Levels – $2.00, $2.50, $3.00
Major Support Levels – $1.50, $1.00, $0.50
What Is the Next Direction for Ripple (XRP)?
XRP/USD is in a downward move as sellers threaten to reach $0.54 low. There is a likelihood of the altcoin reversing from the previous low. Meanwhile, on April 11 downtrend; a retraced candle body tested the 61.8% Fibonacci retracement level. The retracement indicates that XRP will fall to level 1.618 Fibonacci extension or $0.56.
You can purchase crypto coins here. Buy LBlock
Note: Cryptosignals.org is not a financial advisor. Do your research before investing your funds in any financial asset or presented product or event. We are not responsible for your investing results