Polygon (MATIC/USD) Trade Is Below $1.10, Trying Beefing at $1
Estimated Reading Time: 3 minutes
Don’t invest unless you’re prepared to lose all the money you invest. This is a high-risk investment and you are unlikely to be protected if something goes wrong. Take 2 minutes to learn more
Polygon Price Prediction – March 31
A depression force has resurfaced back in the market activates of MATIC/USD in about four days, making the crypto trade to bargain below the line of $1.10, trying beefing around the point of $1 as of the moment of this analysis.
That exchange financial situation has been somewhat strategically set up on a mere slanting path to the north to give a base edge toward fuelling a longing entry above the spot of the $0.90 support dealing line. In a slightly depressing tone, it seems that the previously mentioned line will undoubtedly be the crucial point to delay any abrupt drops that the market would want to take from its current bargaining range.
MATIC/USD Market
Key Levels:
Resistance levels: $1.10, $1.20, $1.30
Support levels: $0.90, $0. $0.85, $0.80
MATIC/USD – Daily Chart
The MATIC/USD daily chart showcases that the crypto market is below the line of $1.10, trying beefing up around the spot of $1.
The stochastic oscillators are in their of placing relatively slanting to he upside to denote that some amounts of pricing gravities are potentially going to hold against some ways of decreases. The Bollinger Band trend lines are slightly positioned with a curve at higher spots to the south, making the support line at $0.90 to a better zone for last possible resort for a fearful correctional velocity.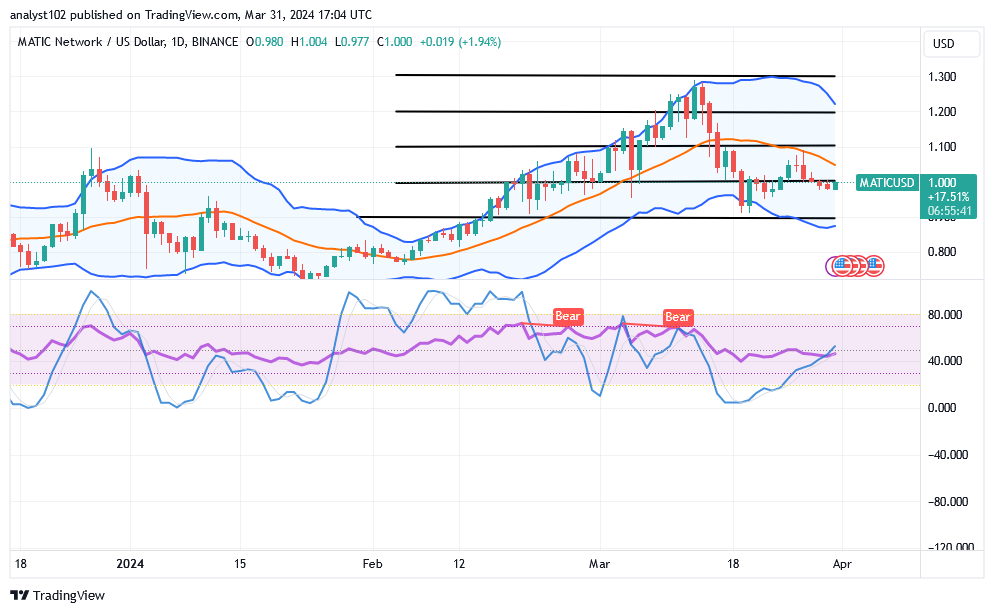
Which indicator component is now displaying a retraction signal against additional increases in the MATIC/USD market business?
Going by the trending forces in the bargaining sentiments of the MATIC/USD market, the most present resistance line has been observed around the path of the middle Bollinger Band, as the crypto trade is below $1.10, trying beefing up back from around $1.
As the support line of $0.90 has been detected as the major baseline for bulls to sustain their energy to maintain some levels against bears, investors should also never desist from their methods of buying and holding even there will still be a moment of aggressive reversal moves afterward.
If the price exhausts its pumping force and the stochastic oscillators indicate an overbought state, bears may decide to go for an order to enter a shorting position once they reorganize the probability of a fall around the middle Bollinger Band. However, the idea of protecting their financial instrument against any hitherto unheard-of large breakout of overhead barriers must serve as their compass.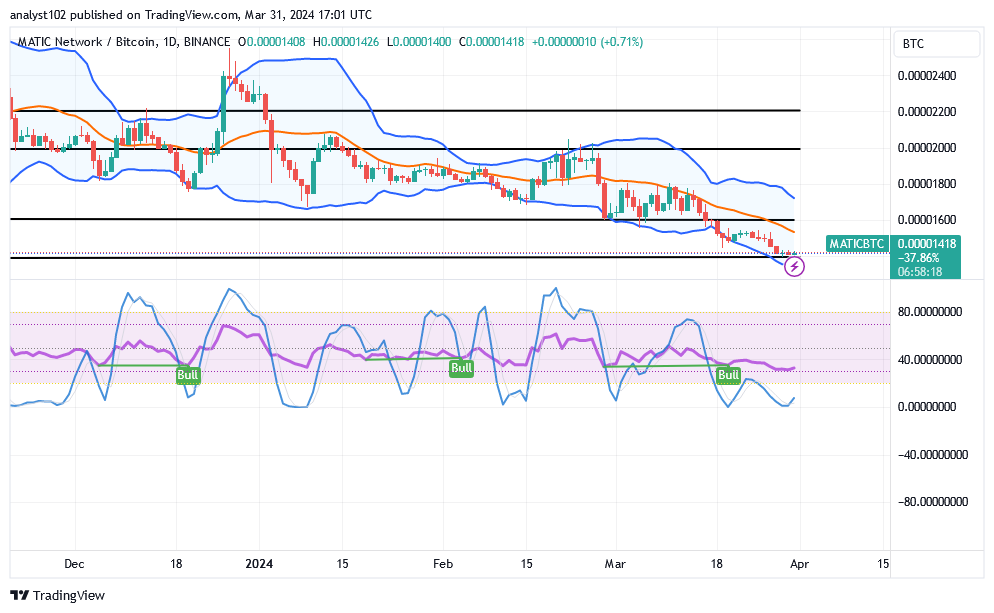
MATIC/BTC Price Analysis
In comparison, Polygon’s economic market is below the middle Bollinger Band, trading southerly alongside the lower Bollinger Band against Bitcoin.
There have been hints that the base instrument is attempting to strengthen up around the lower Bollinger Band, indicating that more lows in the operations to follow typically do not hold. Thee stochastic oscillators have been moving in the oversold region to denote that some step-downs’ attitude is being implemented against the counter crypto economy.
Note: Cryptosignals.org is not a financial advisor. Do your research before investing your funds in any financial asset or presented product or event. We are not responsible for your investing results.
You can purchase Lucky Block here. Buy LBLOCK