Lucky Block Price Prediction: LBLOCK/USD Moves to Break Above $0.000110 Level
Estimated Reading Time: 2 minutes
Don’t invest unless you’re prepared to lose all the money you invest. This is a high-risk investment and you are unlikely to be protected if something goes wrong. Take 2 minutes to learn more
Lucky Block Price Prediction – July 24
The Lucky Block price prediction shows the LBLOCK is preparing to gain pace if it clears the $0.000110 resistance zone.
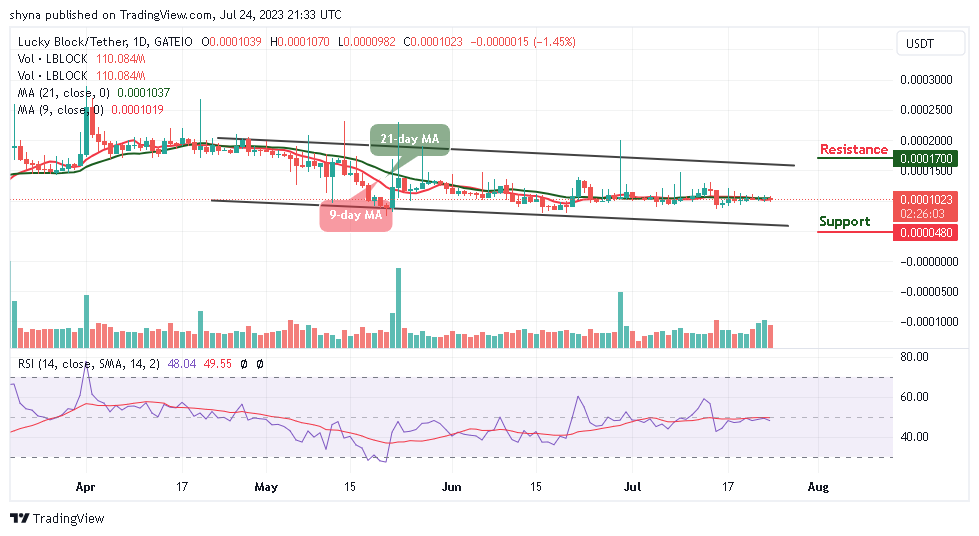
LBLOCK/USD Medium-term Trend: Ranging (1D Chart)
Key Levels:
Resistance levels: $0.000170, $0.000180, $0.000190
Support levels: $0.000048, $0.000038, $0.000028
LBLOCK/USD is getting ready to break above the 9-day and 21-day moving averages as the market price hovers at $0.000102. However, the signal line of the technical indicator Relative Strength Index (14) will confirm the bullish movement as soon as it breaks above the 50-level.
Lucky Block Price Prediction: LBLOCK Bulls Will Spike to the Upside
The Lucky Block price is preparing for the bullish movement as the buyers regroup to increase the buying pressure. However, if the coin spikes to the upside, it will head toward the upper boundary of the channel where it could hit the resistance levels of $0.000170, $0.000180, and $0.000190. On the downside, if the Lucky Block price drops below the lower boundary of the channel, it could reach the support levels at $0.0000048, $0.0000385, and $0.000028.
LBLOCK/USD Medium-term Trend: Ranging (4H Chart)
LBLOCK/USD is also exchanging hands around the 9-day and 21-day moving averages as the technical indicator Relative Strength Index (14) moves within the 50-level. However, a possible bearish drop could surface and any further bearish movement below the lower boundary of the channel could bring the coin to the support level of $0.000085 and below.
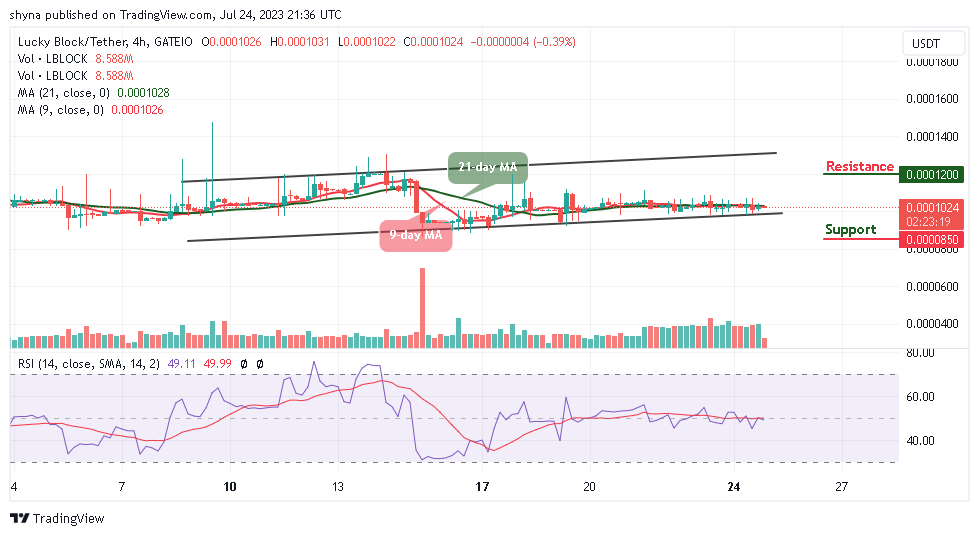
Nevertheless, if the bulls push the coin higher, the LBLOCK price can head toward the upper boundary of the channel. On its way to the upside, the market price would hit the resistance level of $0.000120 and above. Meanwhile, the trading volume is coming up slowly and will begin to climb higher if the technical indicator spikes to the north.
You can purchase Lucky Block here. Buy LBLOCK