Bitcoin Cash (BCH/USD) Price Moves Sideways at a Lower Spot
Estimated Reading Time: 3 minutes
Don’t invest unless you’re prepared to lose all the money you invest. This is a high-risk investment and you are unlikely to be protected if something goes wrong. Take 2 minutes to learn more

Free Crypto Signals Channel
Bitcoin Cash Price Prediction – June 24
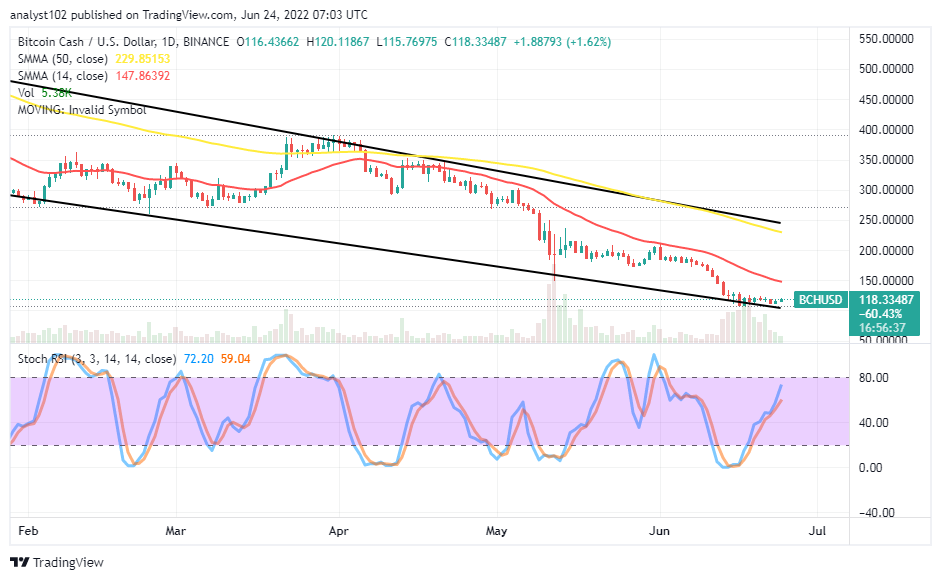
The forces to the upside in the BCH/USD market show the crypto’s price moves sideways at a lower spot. The trade operation is trading at a positive percentage rate of 1.62 between the value lines of $120 and $115.
BCH/USD Market
Key Levels:
Resistance levels: $150, $200, $250
Support levels: $100, $80, $60
BCH/USD – Daily Chart
The BCH/USD daily chart showcases the crypto-economic price moving sideways at a lower spot around the trend line of the lower bearish channel. The 14-day SMA indicator is around the $150 resistance level to affirm its validity underneath the 50-day SMA indicator. The upper bearish channel trend line drew southward at the end above the smaller SMA. The Stochastic Oscillators have moved northbound through variant range lines closer to the 80 range from the beneath. But, the formation of the trading candlesticks has been in a range-moving mode.
Is there any tradable sign in the current BCH/USD market operation?
There has been a less-attraction to the BCH/USD market operations since the crypto-economic price moves sideways at a lower spot near the lower bearish channel trend line. The present trading situation suggests the forces to the upside lack the potency of coming. Long-position takers need to watch out for the outcome of the Stochastic Oscillators’ readings that will denote a lower range zone before considering launching a buying order that has to couple with active price action in the process.
On the downside of the BCH/USD market technical analytics write-up, short-position takers still have a greater chance of pushing the market down from the resistance trading level at $150. Short-position takers needed smaller pull-ups to hit the resistance value-line before having the potential of pushing back in line with the downward-trending path the market has kept over time.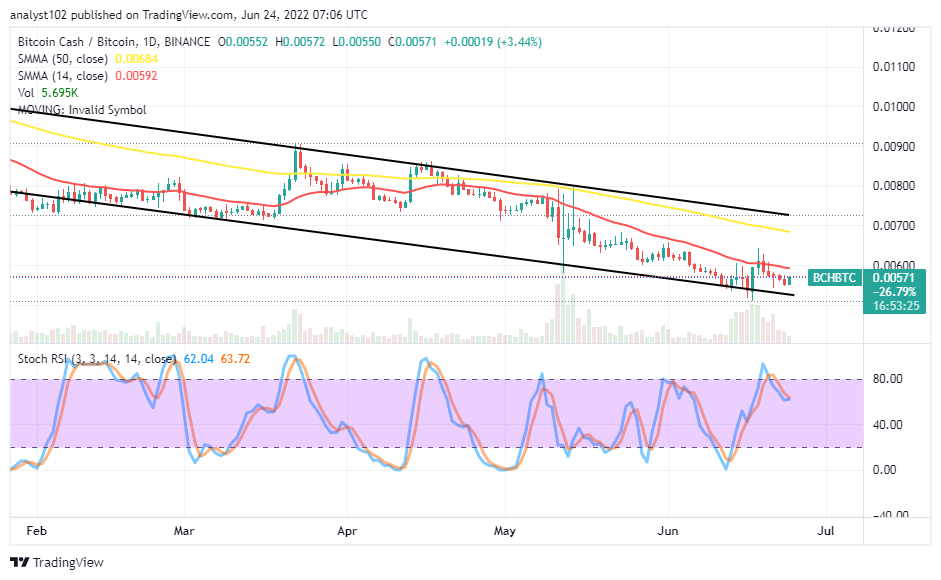
BCH/BTC Price Analysis
Bitcoin Cash market remains downward-trending against the purchasing power of Bitcoin below the sell signal side of the smaller SMA. The cryptocurrency pair price moves sideways briefly under the smaller SMA. The 14-day SMA indicator is underneath the 50-day SMA indicator. And they are within the bearish channel trend lines drawn. The Stochastic Oscillators have briefly crossed southbound against the range of 80. And they are seemingly trying to close the lines not too far below the range value to signify that a pit stop tends to play out for a while. A bullish candlestick needed to occur against the SMA trend line to allow the base crypto a better hedge over the counter-trading crypto.
Note: Cryptosignals.org is not a financial advisor. Do your research before investing your funds in any financial asset or presented product or event. We are not responsible for your investing results.
“Lucky is up more than 50% today but still more than 430% from All Time Highs!
The opportunity to bank BIG is now!
You can purchase Lucky Block here. Buy LBlock