Cardano Price Hovers Around a Critical Level: What’s the Next Move?
Estimated Reading Time: 3 minutes
Don’t invest unless you’re prepared to lose all the money you invest. This is a high-risk investment and you are unlikely to be protected if something goes wrong. Take 2 minutes to learn more

Over the last 24 hours, Cardano against Tether has risen over 2% to $0.26691. This move mirrors a macro-driven recovery in traditional assets as the Cardano price perfectly correlates with the S&P 500 and Gold, climbing from increased market liquidity and its strong beta to Bitcoin. As it stands, the positive social sentiment and Fibonacci support further fueled this bounce.
To this end, future momentum depends on Bitcoin staying above $67,500, as the direction of the token will depend on the ability to stand above or below the immediate support level.
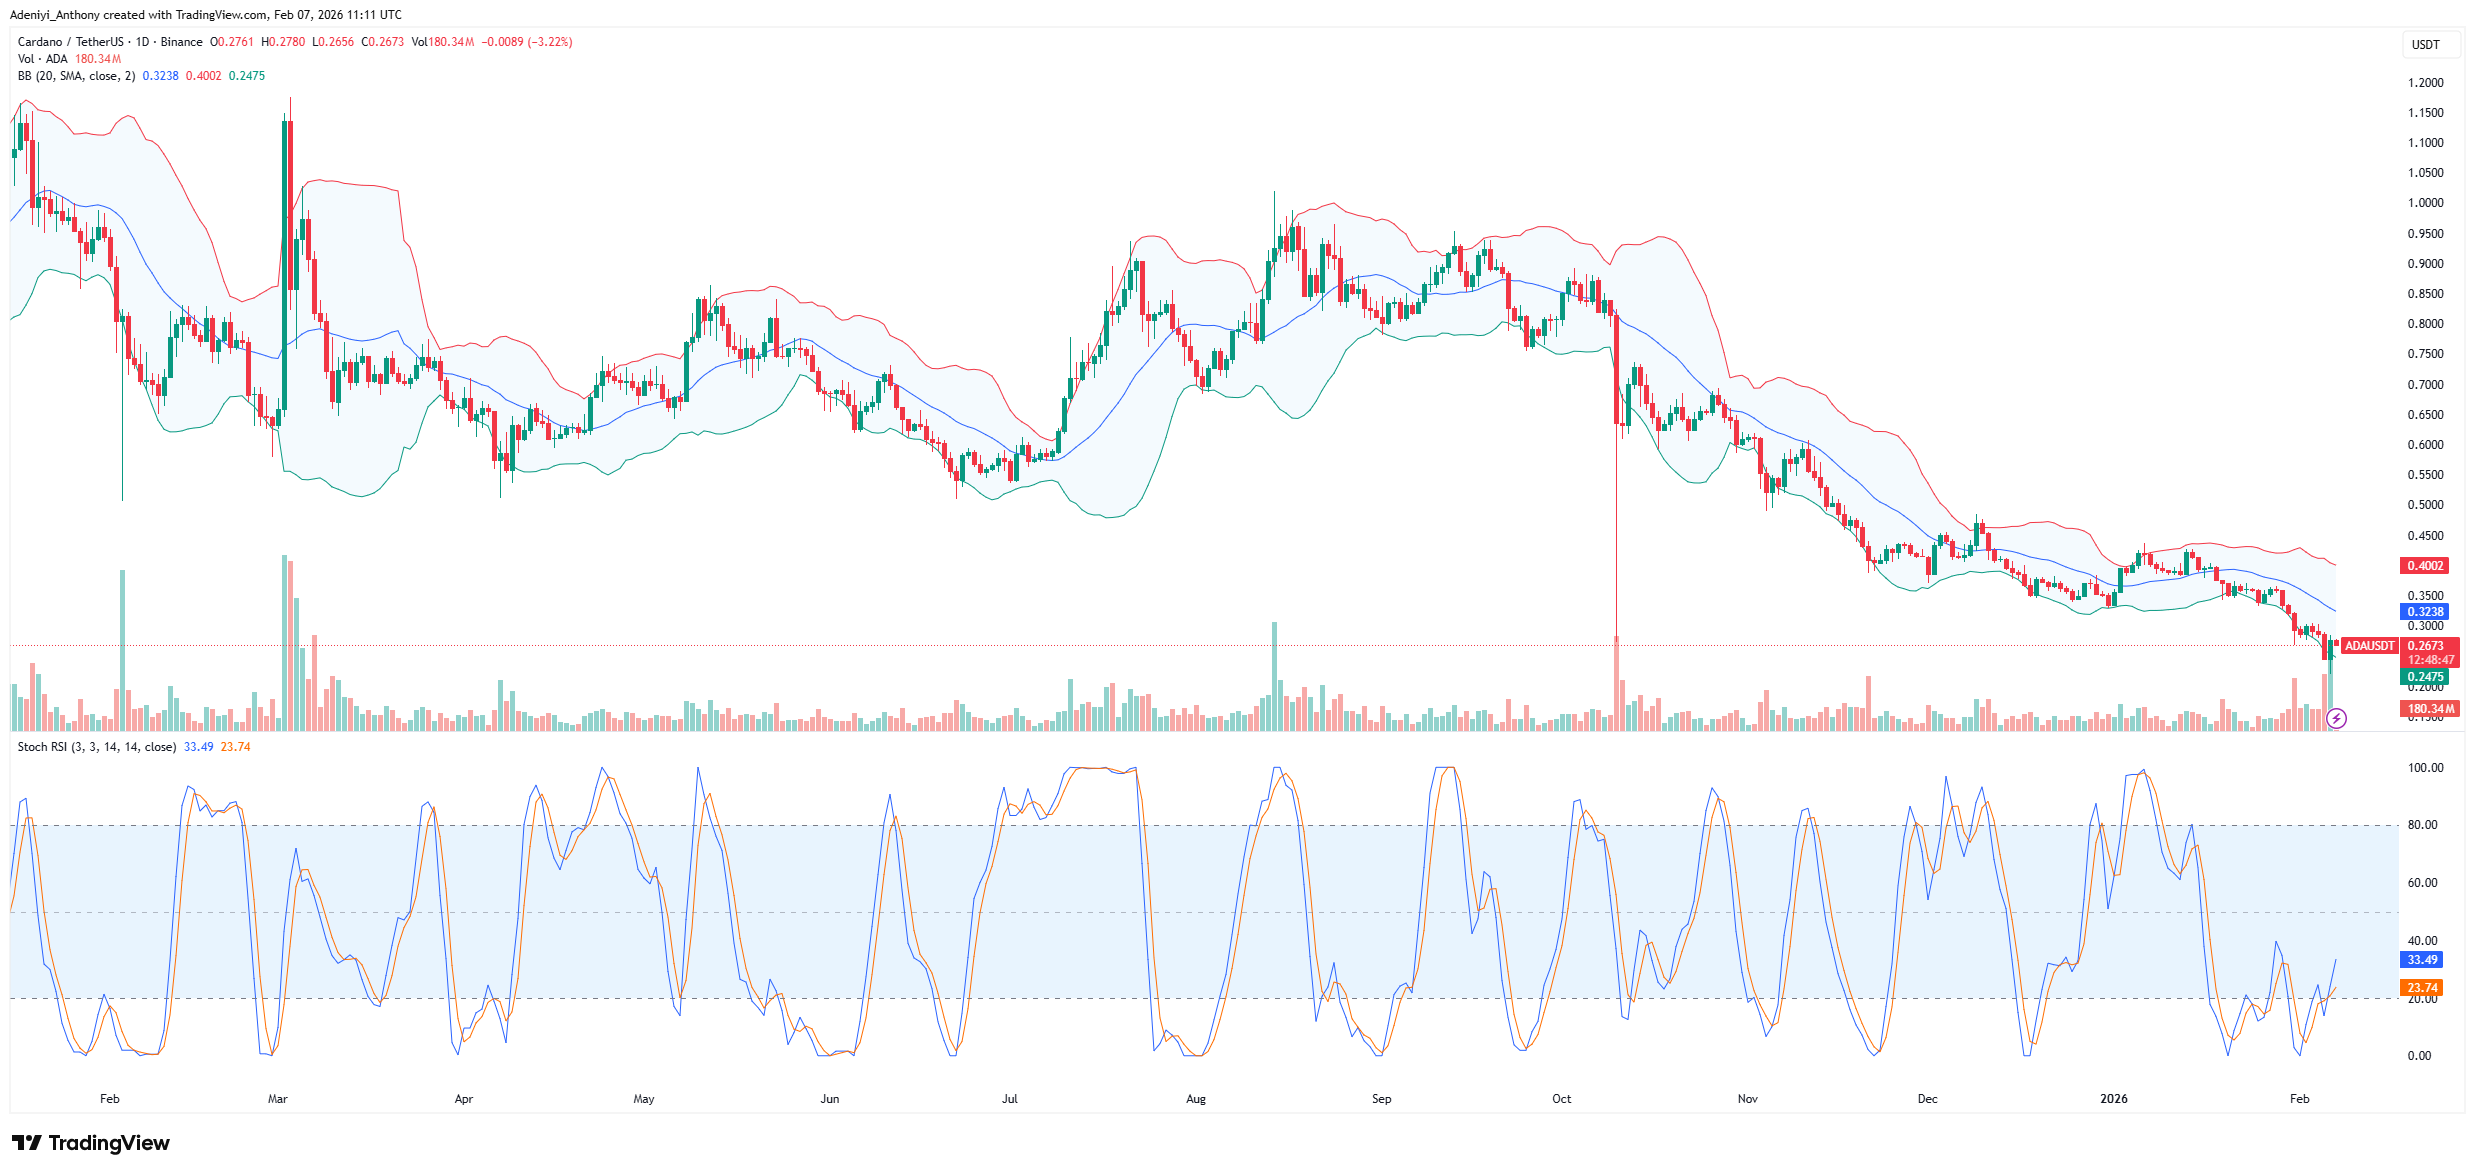
Currently, Cardano trades at $0.2673 with more than 180.34 million traded volumes on the daily timeframe.
Technical Indicators
Major Resistance Levels: $0.3000, $0.3580, and $0.4050
Major Support Levels: $0.2450, $0.2000, and $0.1500
Technical Analysis
Cardano against Tether on the daily chart in recent times has been moving cent by cent to the south as the price action displays successive breaks below support levels since the beginning of 2026. As it stands, the Cardano price operates above $0.2475, where the lower Bollinger band is located. Though this indicates extensive sell pressure, as the Bollinger Bands show no direction different from the previous move. However, recent price action suggests the bulls are ready to contest the $0.300 upper level.
From another angle, the Stochastic RSI beneath the chart is still operating with the 15-to-40-mark level, suggesting an impending proper breakout signal to the upside as the blue line holds and breaks above the orange line. To this end, without a strong bullish crossover and a break above $0.300, the current trend may continue.
Cardano Price Elliott Wave Breakdown: ADA’s Next Move
Analysis for Cardano in recent times has identified three primary Elliott Wave scenarios following the September 2023 lows. One is the orange scenario, which suggests a direct bullish rally toward all-time highs, but this condition remains unconfirmed. Similarly, in the white scenario, the former anticipated a corrective fourth-wave bounce toward resistance between $0.419 and $0.623.
As it stands on a local level, ADA must secure a five-wave advance and break above $0.305 to confirm a bottom. Meanwhile, current price action shows only a three-wave move, signaling caution as another low remains possible, with $0.2400 standing as the next dynamic supportive limit.
ADA/USDT Analysis: Bullish Crossover; What’s Next?
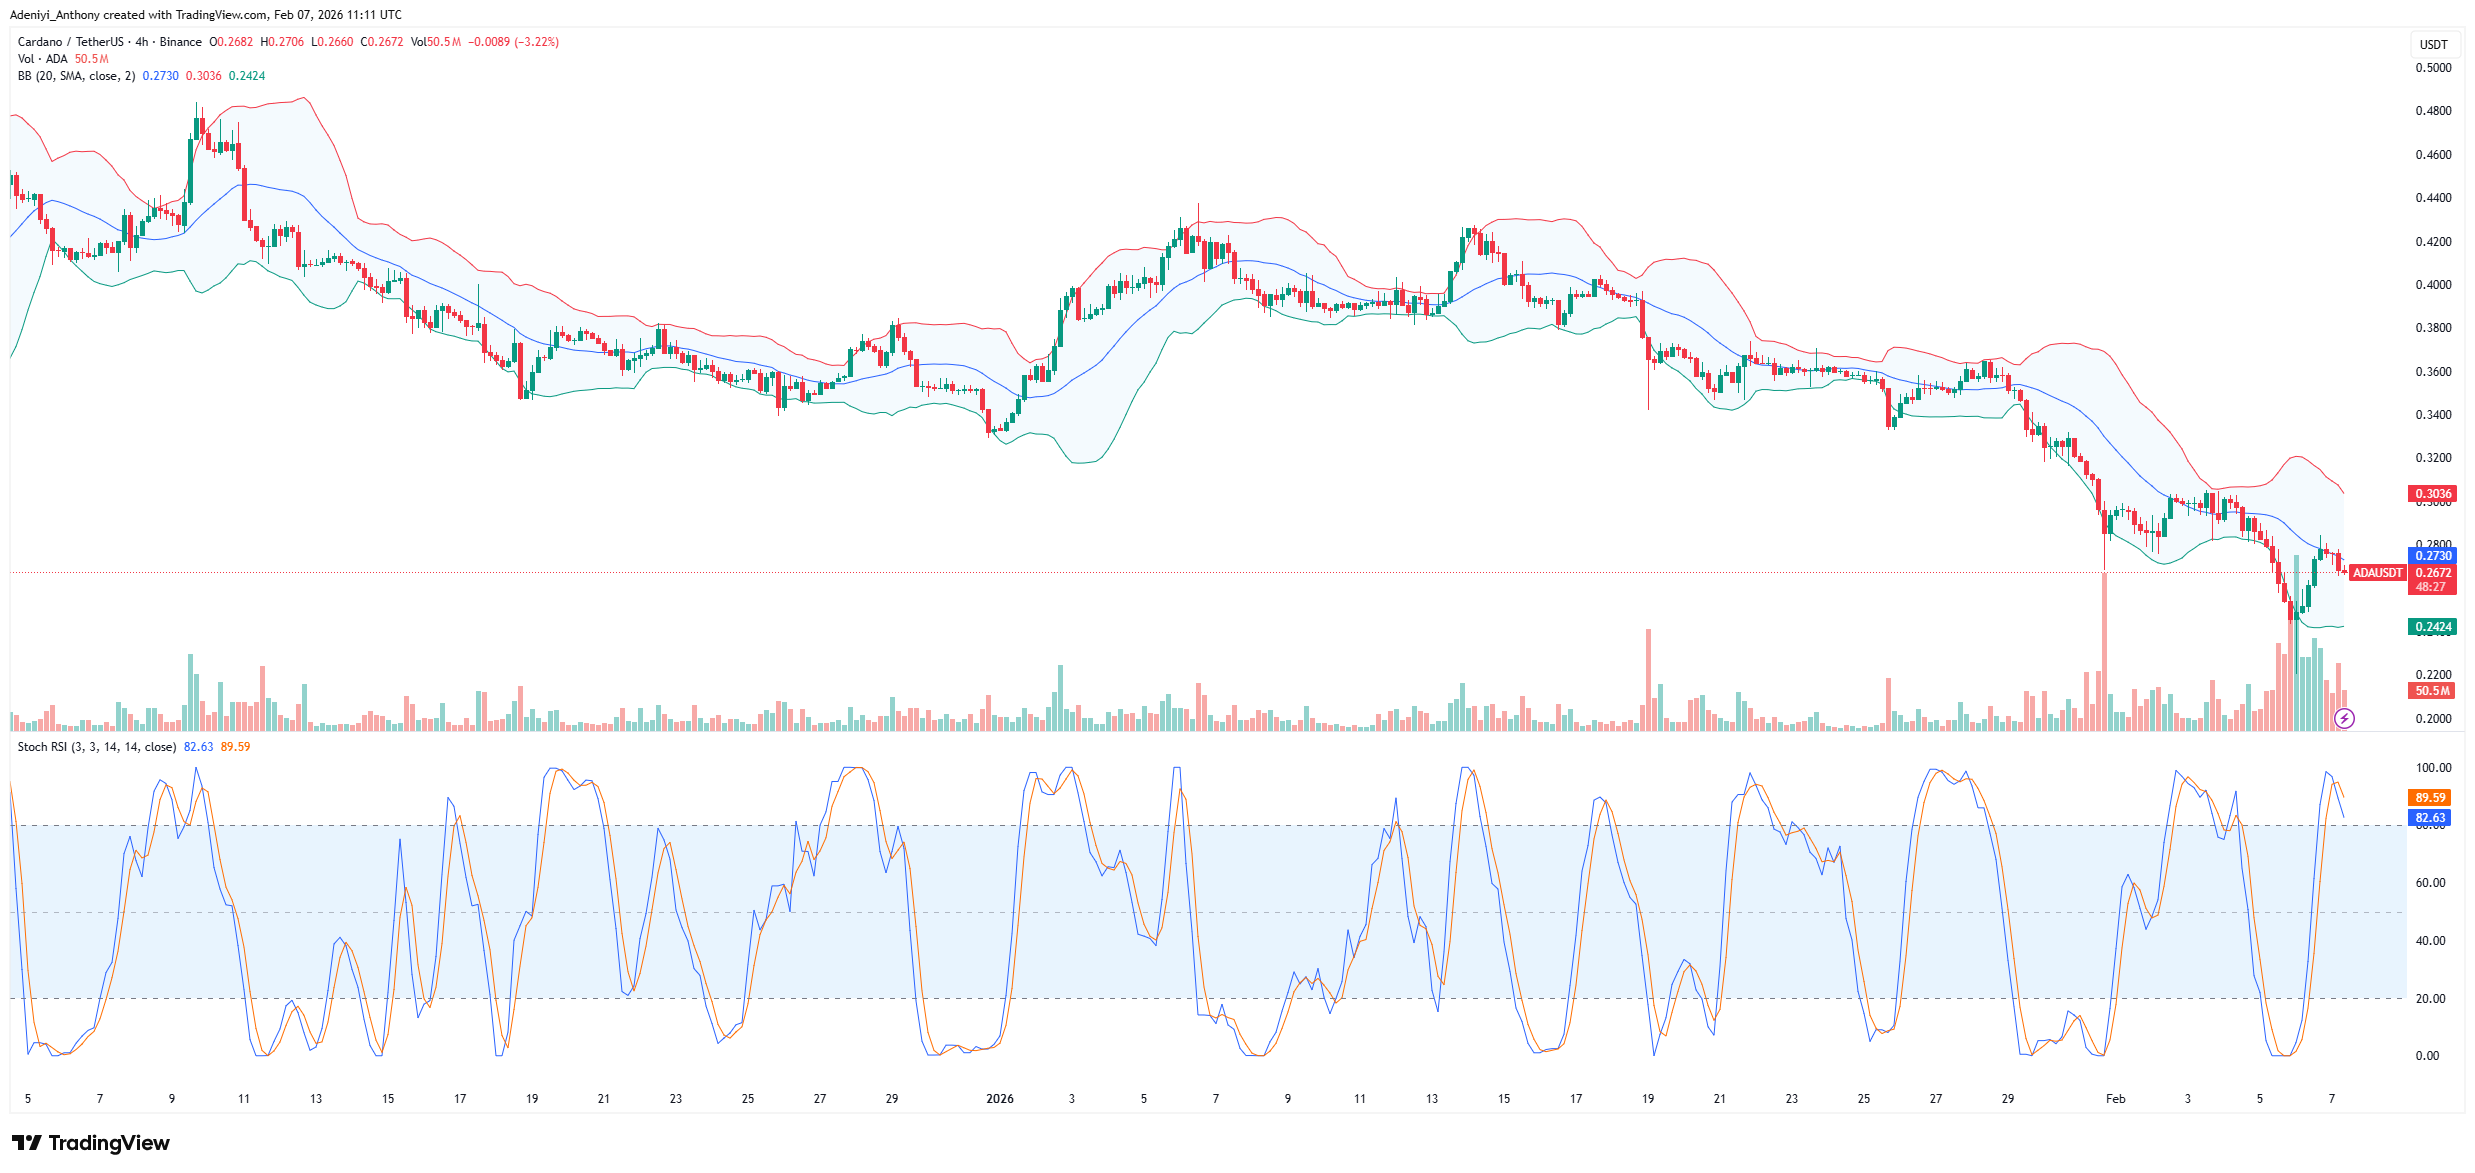
From the shorter timeframe, ADA/USDT seems to be full of optimism and encouraging bullish actions. Cardano price on the 4-hour chart appears to be gearing up for more gains as the Bollinger band expands with increasing volume.
Meanwhile, the momentum oscillator appears to be overbought, with the blue line dropping back from the overbought region. However, despite these recent developments, moving to the north will need a break above the $0.300 dynamic resistance. Conversely, a break below the immediate support will signal another short-term low before any recovery.
You can purchase crypto coins here. Buy Crypto