Bitcoin (BTC) Price Prediction: BTC/USDT Testing Key Resistance
Estimated Reading Time: 3 minutes
Don’t invest unless you’re prepared to lose all the money you invest. This is a high-risk investment and you are unlikely to be protected if something goes wrong. Take 2 minutes to learn more

Bitcoin (BTC) Price Prediction: September 25
Market activity in the Bitcoin daily market reveals that buyers are increasingly eyeing elevated price levels above the $64,000 mark. Meanwhile, the price action in the market is still oscillating around the psychological price level at the $64,000 mark. Technical indicators suggest that a significant break above this level may be on the horizon.
BTC/USDT Long-term Trend: Bullish (Daily Chart)
Key Price Levels:
Resistance: $65,000, $70,000, $75,000
Support: $60,000, $55,000, $50,000
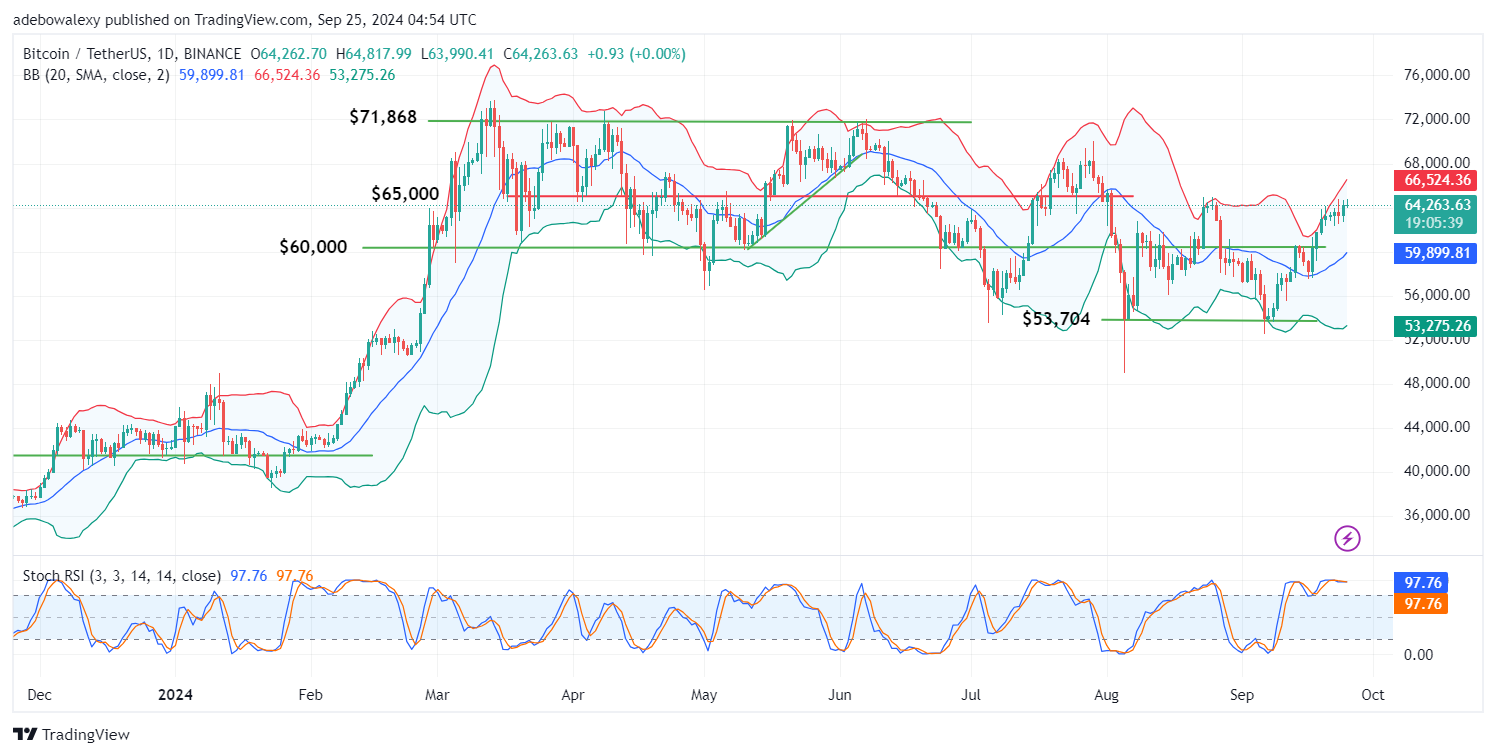
Price action in the Bitcoin daily market has just crossed the psychological resistance at the $64,000 mark. This has kept price action trending further upward, above the middle limit of the applied Bollinger Bands indicator. Simultaneously, the Stochastic RSI lines are lurking around the 100 mark in the overbought region. Also, the last price candle is still green but has contracted downward.
Bitcoin (BTC) Price Prediction: BTC/USDT Market Faces Reduced Volatility
Price activity in the BTC/USDT market has resumed trading above the $64,000 threshold. However, momentum hasn’t gained much strength, considering that price activity has only surfaced above this mark in the ongoing session. Additionally, the last price candle shows that the market still has a shaky footing above this region, given the morphology of the corresponding price candle.
Nevertheless, the Stochastic RSI indicator continues to oscillate near the peak level of the indicator, indicating that upside forces may need to take a break at this point. However, upward forces may leverage the fact that price activity is now a significant distance above the middle limit of the indicator, which will assist buyers in quickly regaining upward focus.
Bitcoin (BTC) Price Prediction: BTC/USDT Trying to Hold onto Upside Focus (4-Hour Chart)
The last price candle on the Bitcoin 4-hour chart is still lurking around the uppermost limit of the Bollinger Bands, despite its bearish characteristics. Additionally, the Stochastic RSI indicator lines show a generally upward trajectory.
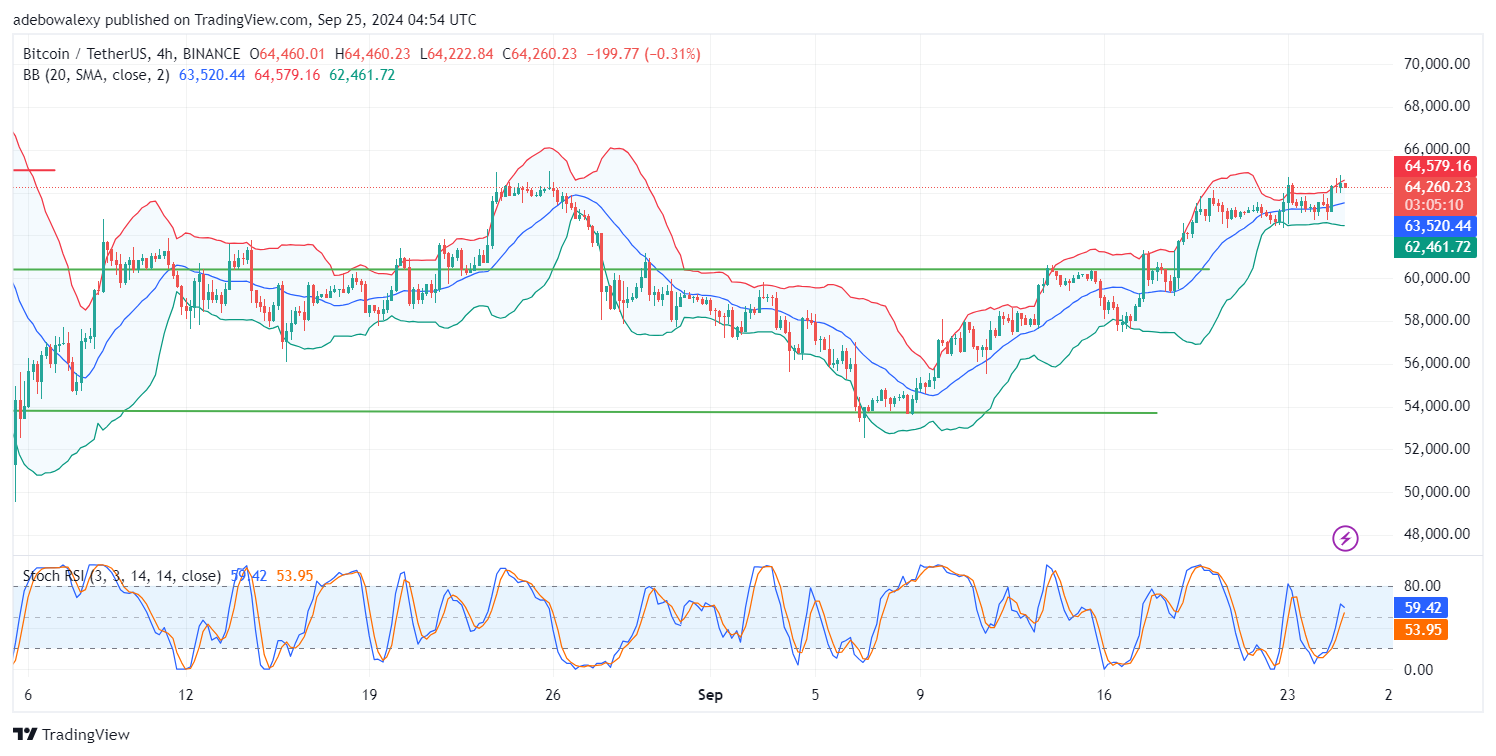
However, the tip of this indicator seems deflected toward a crossover, portraying a potential downward retracement in the ongoing session. Also, the lines of the Stochastic RSI have already moved above the 50 level, suggesting that upside forces may still regain dominance, pushing toward the $65,000 mark.