Litecoin (LTC) Price Prediction: LTC/USDT Stays Retreats Below the $66.50 Resistance
Estimated Reading Time: 2 minutes
Don’t invest unless you’re prepared to lose all the money you invest. This is a high-risk investment and you are unlikely to be protected if something goes wrong. Take 2 minutes to learn more
Litecoin (LTC) Price Prediction: September 24
The Litecoin daily market has retreated below the resistance level of $66.50. This occurred after price activity broke through that mark three sessions ago. It had seemed that price action found support above that mark two sessions ago, but that wasn’t the case.
LTC/USDT Long-term Trend: Bullish (Daily Chart)
Key Price Levels:
Resistance: $66.50, $70.00, $75.00
Support: $60.00, $55.00, $50.00
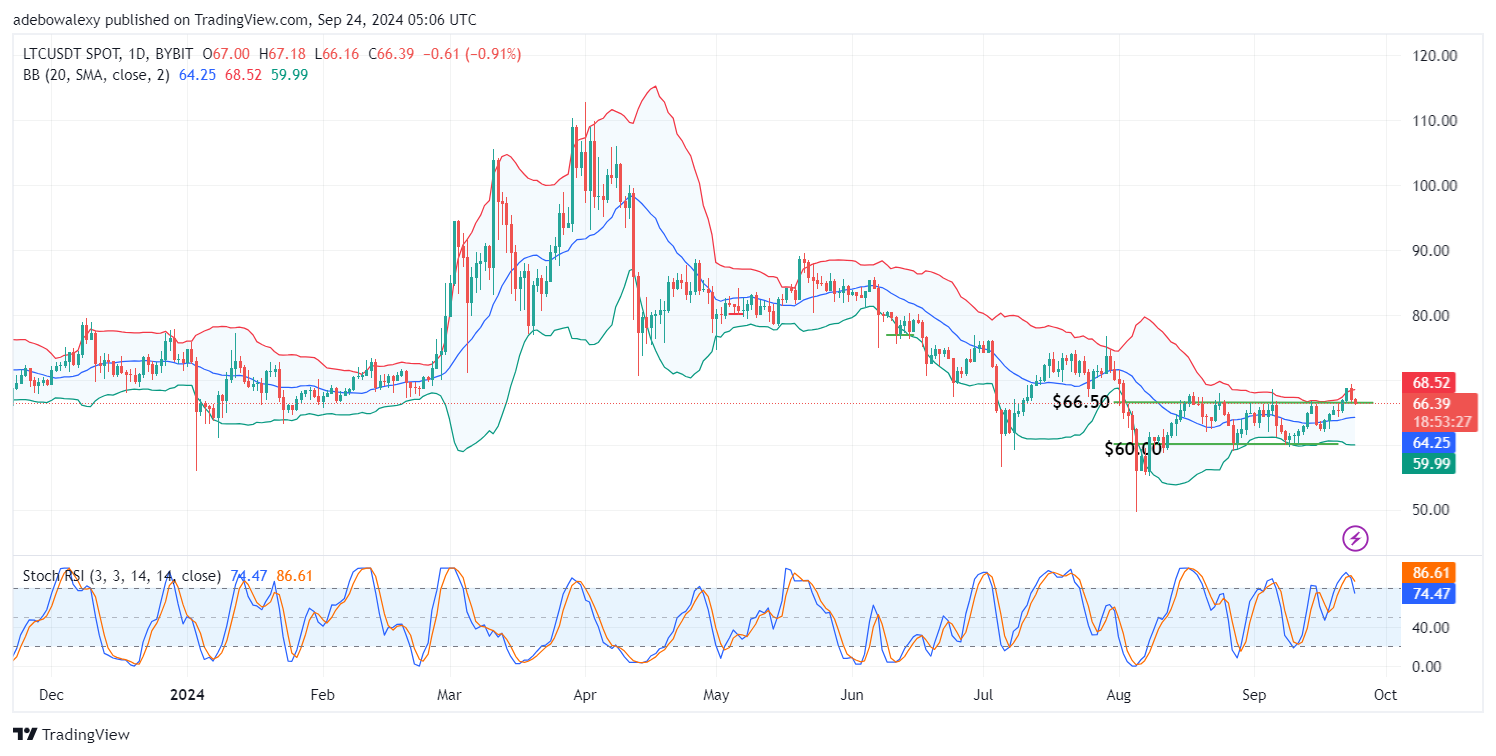
The ongoing session has brought the market back below the $66.50 price level. However, trading activity has continued to occur above the middle limit of the Bollinger Bands (BB) indicator. Also, the Stochastic Relative Strength Index (Stochastic RSI) lines can be seen falling downward through the 80 mark of the indicator. The ongoing session suggests that downward forces are witnessing reduced volatility, as indicated by the appearance of the last price candle.
Litecoin (LTC) Price Prediction: Can the LTC/USDT Market Shake Off Headwinds?
The Litecoin market is maintaining a downward trajectory following a rebound off the upper limit of the BB indicator. Nevertheless, as noted earlier, price action hints that downward forces may be slowing in the current session.
Meanwhile, the Stochastic RSI indicator lines are proceeding downward through an important level. Yet, the market still stands above the middle limit of the BB indicator, suggesting that bearish traders may want to exercise some caution.
Litecoin (LTC) Price Prediction: LTC/USDT Bearish Path Seems Set (4-Hour Chart)
Price activity in the Litecoin market can be seen proceeding further below the middle band of the BB indicator. In fact, on the 4-hour chart, price action has been below the middle band of the indicator since the previous session. At the same time, the Stochastic RSI lines have reached the lowest limit of the indicator, while the leading lines seem poised to linger in that region.
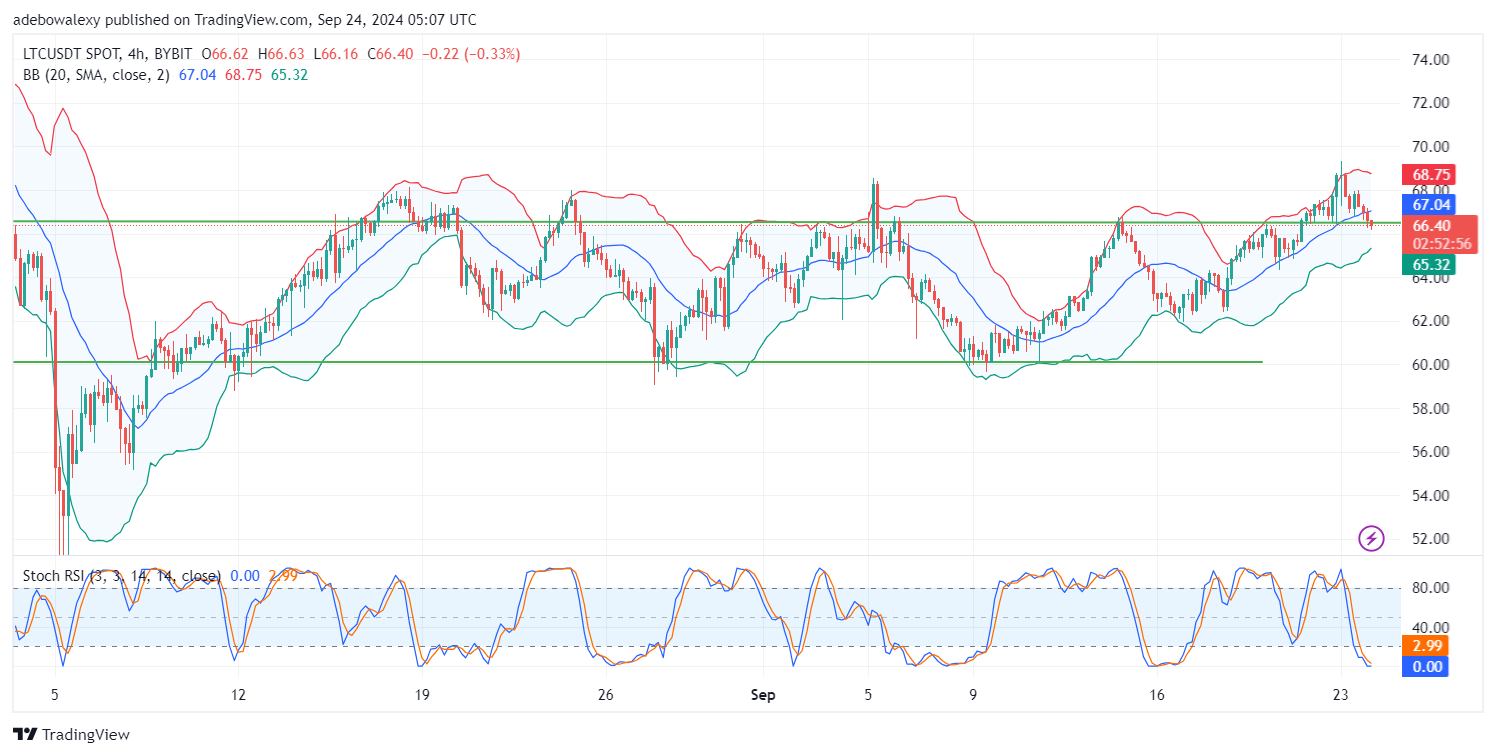
This suggests that the market may proceed downward a bit further, potentially offering bearish traders some short-term gains. Consequently, traders can anticipate support levels at $66.00 and $65.00.