Ripple (XRP) Resumes Uptrend, Faces Resistances at Level $0.72
Estimated Reading Time: 2 minutes
Don’t invest unless you’re prepared to lose all the money you invest. This is a high-risk investment and you are unlikely to be protected if something goes wrong. Take 2 minutes to learn more
![]()
Ripple (XRP) Long-Term Analysis: Bullish
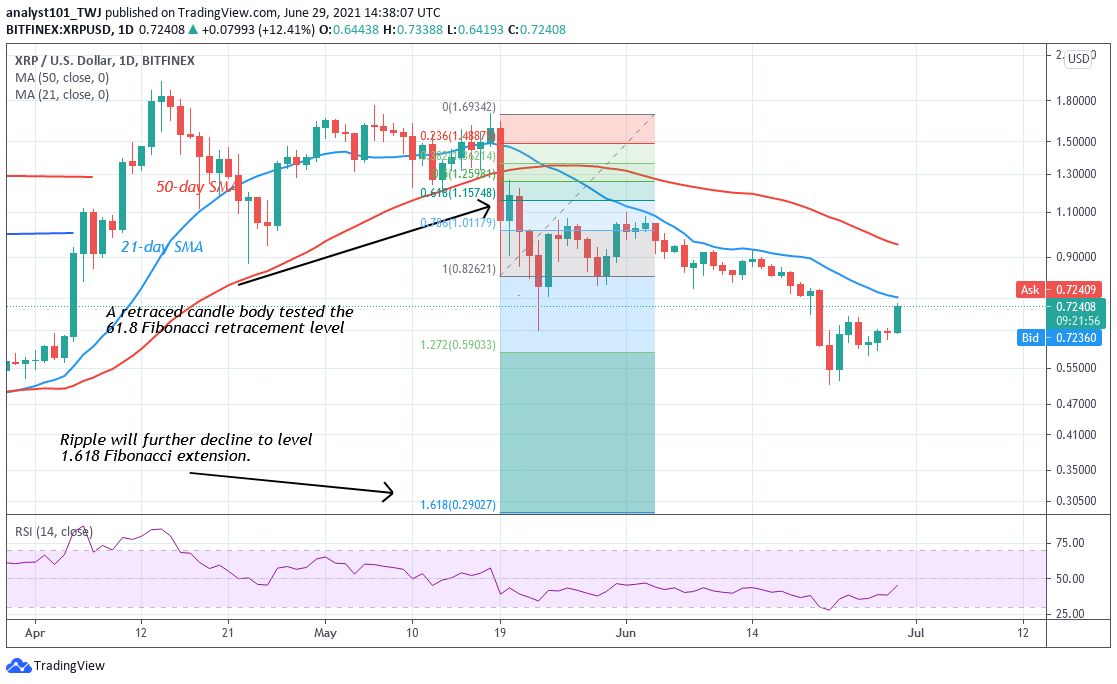
Ripple’s (XRP) price has broken above the $0.65 resistance. This was the previous low which was earlier broken. The market is expected to rise to the previous highs. Nevertheless, if buyers push XRP and it breaks above the $1.10 resistance, the uptrend is likely to resume. On May 19 downtrend, a retraced candle body tested the 61.8 Fibonacci retracement level. The retracement indicates that Ripple will further decline to level 1.618 Fibonacci extension or level $0.29. From the price action, the bulls have taken control of price as the crypto resumes upward.
Ripple (XRP) Indicator Analysis
Ripple has risen 80% of the daily stochastic. The crypto is trading now in the overbought region. Later, sellers may emerge in the overbought region to push prices down. This is an indication of a possible downward movement of the coin. The present upward correction is likely to face rejection. Ripple is at level 45 of the Relative Strength Index period 14. Ripple is still in the bearish trend zone and below the centerline 50.

Technical indicators:
Major Resistance Levels – $2.00, $2.50, $3.00
Major Support Levels – $1.50, $1.00, $0.50
What Is the Next Direction for Ripple (XRP)?
Ripple has to resume an upward move as price breaks above the previous low. The current bullish move must be sustained to break above the previous highs of $0.96 and $1.10. Otherwise, the downward correction will continue. The Fibonacci tool is unlikely to hold as price resumes upward.

You can purchase crypto coins here. Buy Tokens
Note: new.cryptosignals.org is not a financial advisor. Do your research before investing your funds in any financial asset or presented product or event. We are not responsible for your investing results


