Yearn.Finance (YFI/USD) Achieves Annual All-Time High Following Resolution of Indecision
Estimated Reading Time: 3 minutes
Don’t invest unless you’re prepared to lose all the money you invest. This is a high-risk investment and you are unlikely to be protected if something goes wrong. Take 2 minutes to learn more
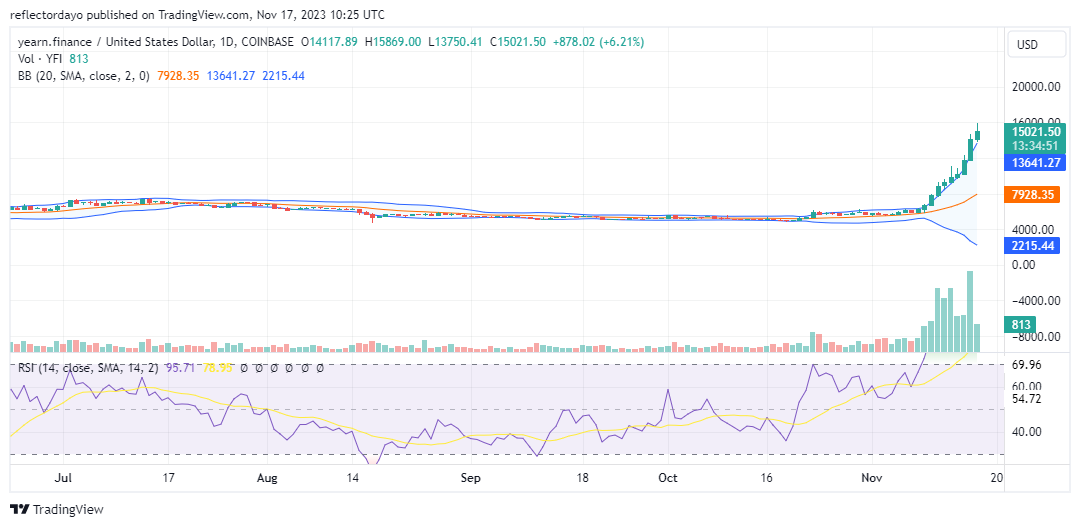
The Yearn.finance market is currently experiencing a notable surge in buying interest, indicative of a positive market sentiment that is effectively breaking the market out of its long-term indecision. From the inception of the year until recently, the Yearn.finance market had been predominantly moving sideways, with price fluctuations constrained within the $11,461 and $4,000 levels, often characterized by predominantly doji candlesticks. However, a significant shift occurred on November 10, marked by the acceleration of bullish market momentum, ultimately breaching the longstanding resistance at $11,461.
Yearn.finance Market Data
- YFI/USD Price Now: $15,370.54
- YFI/USD Market Cap: $501,094,603
- YFI/USD Circulating Supply: 33,232 YFI
- YFI/USD Total Supply: 36,647 YFI
- YFI/USD CoinMarketCap Ranking: #88
Key Levels
- Resistance: $16,000, $16,500, and $17,000.
- Support: $11,000, $10,500, and $10,000.
The Yearn.finance Price Forecast: Analyzing the Indicators
On November 15, the Yearn.finance market successfully breached a longstanding resistance level. This noteworthy development has the potential to incentivize additional bullish traders to initiate long positions, thereby contributing to the continuity of the bullish trend. Simultaneously, the market may encounter substantial resistance around the $16,000 price level, as some long position holders may opt to short their positions, potentially impeding the upward momentum.
This resistance at $16,000 could explain the observed divergence in the Bollinger Bands, reflecting significant bearish activities within the prevailing bullish trend. Despite this, analysis of the volume of trade indicator suggests that the bull market might still have the capacity to sustain its upward trajectory. However, upon reaching the $16,000 price level, a sharp decline in trade volume is evident, likely attributable to a clash between demand and supply dynamics.
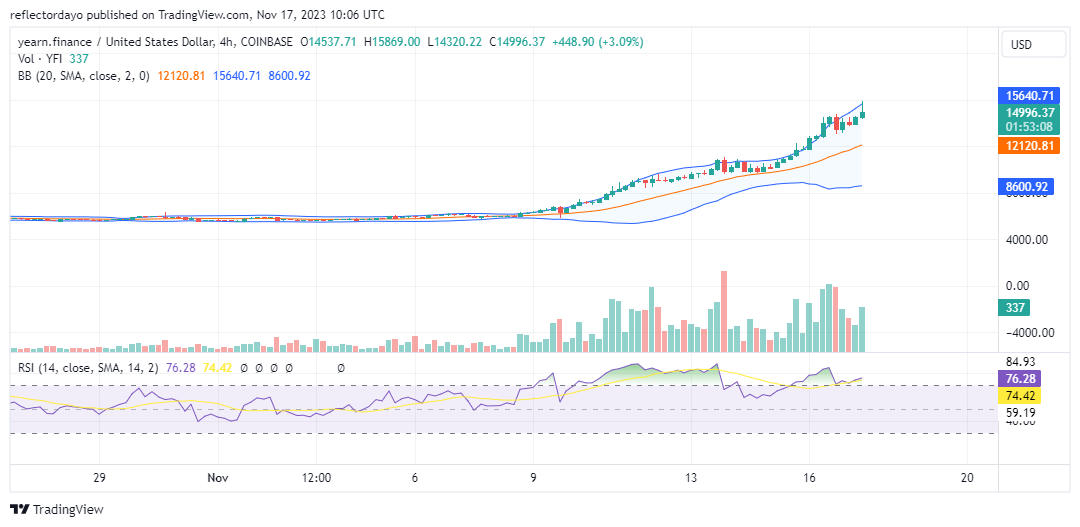
YFI/USD 4-Hour Chart Outlook
In the 4-hour chart analysis, the Bollinger Bands depict an upward-trending price channel, and various indicators suggest a positive market sentiment. However, it is noteworthy that the Relative Strength Index (RSI) is currently positioned in overbought territory, indicating an elevated level of market momentum. While RSI readings in the overbought zone can potentially contribute to bearish sentiment, the volume of trade indicator reveals a heightened level of interest among traders.
Despite the overbought RSI, the robust volume of trade suggests that bullish momentum may persist, allowing the market to advance further into additional territories.